
Methodology
Introduction
The 2023 Climate and Energy Benchmark in the electric utilities sector is the third iteration of this benchmark. This iteration brings together the assessment of companies’ climate strategy and performance together with social performance in the same benchmark and ranking. The performance on climate is examined through an Assessing Low-Carbon (ACT) assessment. Social performance is examined through the just transition indicators (JTI), and core social indicators (CSI). For more details on the methodology please see the methodology report below.
See methodologyScope
In 2022, the generation of electricity was one of the major contributors to global greenhouse gas (GHG) emissions, representing about 25% of global total emissions. The key to all decarbonisation scenarios is the rapid deployment of low-carbon electricity generation technologies. Successful low-carbon transition of energy consuming sectors, among which industry, transport, and building, highly depends on electrification and the decarbonisation of electricity supply. Consequently, companies from this sector are highly relevant to be included in WBA’s benchmarking process.
The benchmark focuses on 68 electric utilities companies active in electricity generation activities and electricity retail. The ACT Electricity methodology considers three different company profiles:
- Pure generation companies: generate electricity to sell and do not purchase any additional electricity from other sources
- Pure retail companies: purchase electricity to sell and do not generate any electricity from company-owned assets
- Mixed profile companies: generate electricity to sell as well as purchasing electricity from other sources
The majority of the companies evaluated (63%) have a mixed profile, meaning that in addition to generation the purchase of electricity for resale accounts for at least 5% of their total sales. Pure generation companies make up 25% of the electric company sample.
This third iteration of the Climate and Energy Benchmark in the electric utilities sector also considers 11 capital goods companies, from which 6 have their core business is the manufacturing of renewable generation technologies, while the remaining 5 are integrated companies with multiple business segment including renewables generation, transmission & distribution, energy storage, automation and digitalisation. These companies have been assessed thanks to the ACT Generic methodology, which structure is flexible enough to assess companies with different profiles and activities.
Approach to scoring and ranking
ACT assessment
A score is given per indicator which is used to calculate the performance element of the ACT score. The narrative assessment is then produced by analysing the company against the four narrative criteria. Data from the performance assessment as well as other verifiable public data on the company such as annual and sustainability reports and news from reliable sources is considered. Finally, the trend score is produced synthesising the forward-looking aspects of the assessment to consider whether the company’s performance would improve, stay the same or worsen if assessed again in the near future.
To create the ACT rating score, a weighting was applied to each of the performance, narrative, and trend scores as follows:
- The performance score has a 1:1 weighting, i.e., a score of 12 is 12;
- The narrative score is weighted: A=20, B=15, C=10, D=5, E=0; and
- The trend score is weighed: “+”=2, “=”=1, “-“= 0.
![]()
Social transformation assessment
The just transition methodology is based on 6 indicators (JTI), which are all scaled on 2 points. JTI 1 and JTI 2 are double-weighted while all other ones (from JTI 3 to JTI 6) are single-weighted.
The core social indicators (CSI) are scaled on 1 point. They all are single-weighted, except CSI 4 and CSI 5 which are double-weighted.
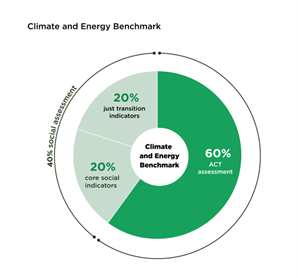
Figure: Total benchmark ranking scores
Aggregation of scores
ACT, CSI and JTI scores are set to 60%, 20% and 20% of the total score respectively. This overall weighted score results in the Oil and Gas Benchmark 2023 ranking.
Total figures for assessments can be subject to rounding differences, but this has not had any overall effect on the ranking.
See our FAQsData collection process
The Electric Utilities Benchmark 2023 assesses the most reliable, latest available, public and verifiable data. Trends in past performance of the company are analysed over five years before the reporting year. 2022 was the most recent year for which complete regulatory data was available, meaning quantitative datapoints were taken from 2017 to 2022.
Data was collected in the first instance from CDP’s disclosure platform where possible, as well as other sources such as specialist databases and public materials from company websites including sustainability and corporate responsibility reports.
Companies were also invited to directly participate in the data validation process by submitting information during a two–week period in September 2023.
All 79 companies were welcome to provide additional information; 27 provided additional data either through the data validation process or by other means within the time period. In total:
- Out of the 68 electric utilities companies, 25 engaged in the data validation process
- Out of the 11 capital goods companies, 2 engaged in the data validation process
Asset level data provided by: