
Methodology
Introduction
The Assessing low-Carbon Transition (ACT) automotive manufacturing sector methodology is a product of the ACT initiative, which assesses an organisation’s readiness to transition to a future low-carbon world and aims to drive action by companies to move to a 1.5 °C pathway in terms of their climate strategy, business model, investments, operations, and greenhouse gas emissions management. The ACT initiative, a joint project between ADEME and CDP, has created an overarching framework and sector-specific methodologies, of which the automotive manufacturing methodology is one.
The ACT automotive manufacturing methodology includes principles, scope, boundaries and performance indicators, as well as performance, narrative and trend scoring explanations. The methodology was developed through research and multi-stakeholder dialogue. ACT builds on the Sectoral Decarbonization Approach (SDA), developed by the Science-Based Targets Initiative (SBTi), to compare a company’s alignment to the low-carbon pathway. (See explanatory note below.)
Together with ACT and CDP, the World Benchmarking Alliance (WBA) has translated this methodology into the Automotive Benchmark 2019, Automotive 2020 Performance Update and this latest Automotive Benchmark 2021. A summary and explanation of how the ACT automotive manufacturing methodology was applied in 2019 is contained here. For this Automotive Benchmark 2021, full assessment including performance, narrative and trend has been undertaken for the 30 companies. The full list of 30 companies is available here.
This Automotive Benchmark 2021 forms the third of a series of rankings and updates within the Climate and Energy Benchmark of the WBA. As well as previous Automotive assessments, this ranking series measured and ranked the climate action performance of 50 keystone electric utilities in 2020. It will continue to measure and rank the climate action performance of companies in other high carbon emitting industries within the decarbonisation and energy system, including oil and gas, transport, real estate and construction.
Scope
The WBA Automotive Benchmark 2021 is a sector-specific benchmark within the WBA Climate and Energy Benchmark. The Climate and Energy Benchmark will clarify where and how companies can contribute to SDG 13, SDG 7, and the Paris Agreement, and incentivise them to align their strategies and operations with a 1.5 °C pathway. It is part of the decarbonisation and energy transformation identified by the WBA as one of the seven system transformations required to achieve the Sustainable Development Goals (SDGs).
An assessment of the SDGs and corresponding targets demonstrated that the decarbonisation and energy transition will have an evident impact on SDG 1 (no poverty), SDG 3 (good health and wellbeing), SDG 7 (affordable and clean energy), SDG 9 (industry, innovation and infrastructure), SDG 12 (responsible consumption and production), SDG 13 (climate action) and SDG 17 (partnerships for the goals), amongst others.
All WBA benchmarks build on existing standards and norms and seek to draw on existing frameworks and initiatives. For this reason, the ACT methodologies have been adopted as suitable existing methodologies. The ACT methodologies, used to create the Climate and Energy Benchmark, can act as roadmaps, setting out how high-emitting companies can contribute to the decarbonisation and energy transformation and achieving SDGs 1, 3, 7, 9, 12, 13 and 17 – amongst others – and the Paris Agreement.
Before the Climate and Energy Benchmark began, a mapping exercise identified that the Taskforce on Climate-related Financial Disclosures (TCFD) was strongly aligned with the benchmark (although their objectives and audiences differ slightly). The Climate and Energy Benchmark uses data that the TCFD promotes the publication of, while the benchmark can allow financial actors to better understand transition risk. Both initiatives focus on companies’ governance, metrics and targets, and aspects of risk management practices (such as low-carbon transition planning and climate change scenario analysis). You can read more about the relationship between the WBA Climate and Energy Benchmark, ACT and the TCFD by clicking here.
Industry scope
Within the automotive sector, the WBA Automotive Benchmark and Update includes companies with activities in automobile manufacturing. These activities include the design of ‘light duty’ vehicles (cars) and their final assembly. They do not include the manufacturing of vehicle parts.
Company scope
The automotive sector’s keystone companies are included in the Automotive Benchmark 2021. The ‘keystone company’ is based on the concept and characteristics of keystone actors as defined by Österblom et al in 2015, as those that play a vital role in the industry and have a disproportionate effect on the structure and function of the system in which they operate. Of the potential global automotive manufacturers, 30 keystone companies were included in the Benchmark and Update based on the following criteria:
- Companies that dominate global production or service revenues and volumes within the automotive manufacturing sector.
- Companies that control globally relevant segments of production and/or service provision, based on an assessment of vehicles sold.
- Companies that connect (eco)systems globally through subsidiaries and supply chains.
- Companies that influence global governance processes and institutions.
- Companies that have a global footprint, particularly significant in developing countries.
Assessments
Assessment 2021
Like every ACT methodology, the full ACT automotive manufacturing methodology assessment generates a rating comprising:
A performance score – represented as a number from 1 (lowest) to 20 (highest) – presents a broad and modulated view of company performance across key levers for low-carbon transition.
A narrative score – represented as a letter from A (highest) to E (lowest) – provides a holistic view of a company’s state of alignment with the goals of the Paris Agreement.
A trend score – represented as “+” for improving, “=” for remaining the same, or “-“ for worsening – signals the near-term movement of company alignment with the low-carbon economy.
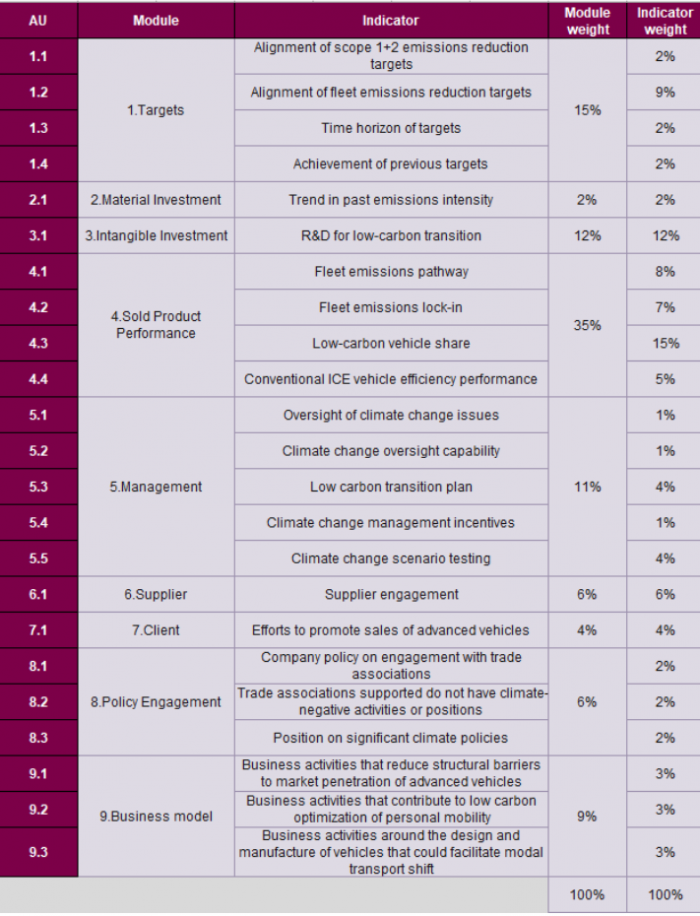
For the performance assessment, company data is analysed across nine modules: targets, material investment, intangible investment, sold product performance, management, supplier engagement, client engagement, policy engagement, and business model. Each of these modules contains indicators, and each module and indicator has a weight (see figure below). The weights are determined by the importance of each module in driving the decarbonisation of the company, data availability and quality, and how future oriented they are.
A company’s module-level scores, and the overall performance score, are presented in each full WBA company scorecard. The text in the “Leading practices” and “Risks and opportunities” section give an additional commentary on a selection of performance assessment modules.
The narrative assessment is an overall analysis of all available data sources (including sources additional to those used for the performance assessment) to establish a company’s state of alignment with the goals of the Paris Agreement. The narrative assessment considers the performance assessment, as well as further analysis of the company based on four criteria: business model and strategy; consistency and credibility; reputation; and risks. The overall narrative score is presented in each WBA company scorecard. The section “Progress towards the Paris Agreement provides additional commentary on each of the five ACT guiding questions that create consistent ACT ratings: on commitments, transition planning, present activities, legacy and consistency.
For the trend assessment, the company is assigned a “+”, “=”, or “-”, depending on whether the analyst deems that the future company will be less, equally or more able to meet the requirements of the low-carbon transition in a re-assessment in the near-term. This is presented in each WBA company scorecard. The section “Trend” provides commentary on the trend assessment.
Approach to scoring and ranking – 2021
A score is given per indicator which is used to calculate the performance element of the ACT score. The narrative assessment is then produced by analysing the company against the four narrative criteria. Data from the performance assessment as well as other verifiable public data on the company such as annual and sustainability reports and news from reliable sources is considered. Finally, the trend score is produced synthesising the forward-looking aspects of the assessment to consider whether the company’s performance would improve, stay the same or worsen if assessed again in the near future.
To create the overall Automotive ranking, a weighting was applied to each of the performance, narrative, and trend scores as follows:
- The performance score has a 1:1 weighting, i.e., a score of 12 is 12;
- The narrative score is weighted: A=20, B=15, C=10, D=5, E=0; and
- The trend score is weighed: “+”=2, “=”=1, “-“= 0.
This overall weighted score resulted in the Automotive 2021 ranking.
Total figures for performance assessments can be subject to rounding differences, but this has not had any overall effect on the ranking.
Data collection process
The Automotive Benchmark 2021 assesses the most reliable, latest available, public and verifiable data. Trends in past performance of the company are analysed over five years before the reporting year. 2020 was the most recent year for which complete regulatory data was available, meaning quantitative datapoints were taken from 2015 to 2020
Data was collected in the first instance from CDP’s disclosure platform where possible, as well as other sources such as specialist databases and public materials from company websites including sustainability and corporate responsibility reports.
Companies were also invited to directly participate in the data validation process by submitting information during a two–week period, between 13th September and 22nd October 2021.
All 30 companies were welcome to provide additional information; 10 of 30 provided additional data either through the data validation process or by other means within the time period.
Disclosing company scores
Scores for each company are available publicly, for all stakeholders:
- For the performance assessment, at indicator, module and overall score level;
- For the narrative assessment, at the overall score level;
- For the trend score, at the overall score level.
Individual company results are presented in the company scorecards. Module-levels rankings are presented in the ‘Ranking’ section of the website. Cross-sample analysis of performance in each module is available in the Insights report.
For all 30 companies:
An excel file containing the score summary, module, indicator-level scores for all 30 companies, as well as more about the companies’ data availability and participation in the data validation process, is available here.
Methodology development
The ACT automotive manufacturing methodology was developed according to a robust, credible, and replicable process. It was built based on extensive research and outcomes resulting from multi-stakeholder dialogues.
The ACT automotive manufacturing methodology was first developed by CDP and ADEME in 2016. ACT methodologies are based on the principles and guidelines of the publicly available ACT Framework. It was then revised and updated during 2018 to reflect the updated Science Based Targets initiative’s (SBTi) Transport Tool and updated underlying scenarios. ACT methodologies are based on the principles and guidelines of the publicly available ACT Framework.
Consultation process
The ACT automotive manufacturing methodology was developed in consultation with companies and experts in the sector, and pilot companies reported against the methodology and received an ACT pilot assessment and rating privately. Groupe PSA, Renault and IAN Motion participated in this pilot company road test.
The methodology had input from a Technical Working Group (TWG), Advisory Group, and public consultation from February 2016 to January 2017. You can find out more via the ACT initiative website: https://actinitiative.org/ and about participating companies here: https://actinitiative.org/about-us/.
Development process
Feedback from the TWG, Advisory Group, and public consultation informed the direction of the methodology and consultation feedback was considered in the final published version of the ACT automotive manufacturing sector methodology.
Publication of WBA Automotive Benchmark 2021
In November 2021, the key findings and company scorecards were published online, with the Benchmark officially launched on 24 November. The WBA company scorecard had previously been made available to each company to inform them of their scores.
Explanatory note
In both the WBA key findings and company scorecards, the term ‘1.5 °C pathway’ is used to refer to the ‘company benchmark’ pathway. This is the pathway allocated to an individual company from the sector decarbonisation pathway, built on the Sectoral Decarbonisation Approach (SDA) of the Science-Based Targets Initiative (SBTi) using the 2021 International Energy Agency’s Net Zero by 2050 (NZE) scenario. This scenario is consistent with providing a 50% chance of limiting long-term average temperature rise to 1.5°C. The ACT automotive methodology requires detailed and specific scenario information, meaning that some reference information from scenarios other than the IEA’s Net Zero by 2050 has been used where appropriate.
Several decarbonisation pathways aligned with a 1.5°C scenario were developed:
- Scope 1 and 2 emissions intensity based on the IEA’s NZE electricity intensity
- Low-carbon vehicle sales share evolution based on the IEA’s NZE
- Internal combustion engine fuel economy improvements based on the ICCT’s Vision 2050
- Scope 3 (use of sold products) emissions from new light duty vehicle sales pathway. This was calculated by applying the effect of increased low-carbon vehicle sales and internal combustion engine fuel economy improvements.
The IEA’s NZE report and dataset is available here https://www.iea.org/reports/net-zero-by-2050. Other reference data, e.g. on light duty sales evolution, to inform the company 1.5 °C decarbonisation pathways came from the IEA Net Zero by 2050 and the ICCT Transport Roadmap. The expectation for the percentage of capital expenditure (CapEx) that should be dedicated to low-carbon research and development (R&D) was based a report by Oliver Wyman and CDP Europe[1]. This states that the share of low-carbon investment in CapEx must increase from 12 to 25 percent across all industries to deliver net-zero emissions by 2050. In the automotive sector, the report states 93% of the low-carbon investment is dedicated to R&D. Consequently, the expectation established was that 23.5% of automotive capital expenditure should be dedicated to low-carbon research and development to align with 1.5°C.
Regulatory data for the companies’ vehicle in-use emissions is only available on a tank-to-wheel rather than a well-to-wheel basis. Consequently, the scope 3 decarbonisation pathways applied for these assessments were established on a tank-to-wheel basis.
You can read more about the application of the sector and company benchmarks and other quantitative benchmarks in the ACT automotive manufacturing methodology: https://actinitiative.org/
[1] https://www.oliverwyman.com/content/dam/oliver-wyman/v2/publications/2020/February/Doubling-Down.pdf
Other technical notes
All monetary values are expressed in US dollars (US$) using the World Bank’s official average annual USD exchange rates database.