
Methodology
Methodology
The 2023 Climate and Energy Benchmark in the buildings sector is the second to combine an assessment of companies’ climate strategy and performance together with social performance in the same benchmark and ranking. The performance on climate is examined through an Assessing Low-Carbon (ACT) assessment. Social performance is examined through the just transition indicators (JTI), and core social indicators (CSI). For more details on the methodology please see the report below.
See methodologyScope
Emissions from the buildings sector, including buildings operation, materials manufacturing and buildings construction, was responsible for 37% of all global CO2 emissions in 2021, making it, alongside transportation, globally one of the highest emitting sectors. As a result, WBA has identified this sector as crucial to be included in the benchmark process. The Buildings Benchmark assesses 50 keystone building companies that have a significant influence on achieving the Paris Agreement goals and the SDGs.
The structure of the buildings sector is complex, with varying levels of influence over emissions reduction among companies in the different subsectors – property developers, construction companies, and property managers. In line with the scope of the ACT methodologies and available decarbonisation scenarios, this benchmark covers companies operating in at least one of the following activities: property development, construction, or property management.
Over the 50 assessed companies, a majority of them (31 / 62%) operate across more than one subsector. However, most companies focus on one subsector, with 17 (34%) specialising in property management and 24 (48%) companies in property development or construction. Only nine (18%) companies having significant activities across both property management and property development or construction activities.
Approach to scoring and ranking
ACT assessment
A score is given per indicator which is used to calculate the performance element of the ACT score. The narrative assessment is then produced by analysing the company against the four narrative criteria. Data from the performance assessment as well as other verifiable public data on the company such as annual and sustainability reports and news from reliable sources is considered. Finally, the trend score is produced synthesising the forward-looking aspects of the assessment to consider whether the company’s performance would improve, stay the same or worsen if assessed again in the near future.
To create the ACT rating score, a weighting was applied to each of the performance, narrative, and trend scores as follows:
- The performance score has a 1:1 weighting, i.e., a score of 12 is 12;
- The narrative score is weighted: A=20, B=15, C=10, D=5, E=0; and
- The trend score is weighed: “+”=2, “=”=1, “-“= 0.
Social transformation assessment
The just transition methodology is based on 6 indicators (JTI), which are all scaled on 2 points. JTI 1 and JTI 2 are double-weighted while all other ones (from JTI 3 to JTI 6) are single-weighted.
The core social indicators (CSI) are scaled on 1 point. They all are single-weighted, except CSI 4 and CSI 5 which are double-weighted.
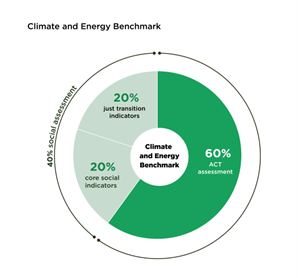
Figure: Total benchmark ranking scores
Aggregation of scores
ACT, CSI and JTI scores are set to 60%, 20% and 20% of the total score respectively. The ACT rating score is normalised to 60 and the just transition total score is normalised to 20. This overall weighted score results in the Transport Benchmark 2022 ranking.
Total figures for assessments can be subject to rounding differences, but this has not had any overall effect on the ranking.
Read our FAQData collection process
The Buildings Benchmark 2023 assesses the most reliable, latest available, public and verifiable data. Trends in past performance of the company are analysed over five years before the reporting year. 2022 was the most recent year for which complete regulatory data was available, meaning quantitative datapoints were taken from 2017 to 2022.
Data was collected in the first instance from CDP’s disclosure platform where possible, as well as other sources such as specialist databases and public materials from company websites including sustainability and corporate responsibility reports.
Companies were also invited to directly participate in the data validation process by submitting information during a two–week period within December 2022.
All 50 companies were welcome to provide additional information; 14 provided additional data either through the data validation process or by other means within the time period.
See the data set