
Methodology
Introduction
The 2024 Climate and Energy Benchmark in the automotive and transportation manufacturers sector brings together the assessment of companies’ climate strategy and performance together with social performance in the same benchmark and ranking. The performance on climate is examined through an Assessing Low-Carbon (ACT) assessment. Social performance is examined through the just transition indicators (JTI), and core social indicators (CSI). For more details on the methodology please see the methodology report below.
See methodologyScope
The transformation required to decarbonise the movement of people and freight starts with the technological choices for powering aircraft, ships, trains, and vehicles. By 2030 sales of electric vehicles need to outstrip conventional ones (IEA 2024), hydrogen-powered ships must be market-ready (IEA 2023) and the first hybrid electric regional aircraft take-off (IATA 2023). With a sector that is responsible for about 21% of global energy emissions, we aim to assess how keystone manufacturers are preparing for this technological shift.
The movement of people and goods across our cities, regions and continents released 8 Gt of CO2 in 2022, about 21% of global energy-related emissions (IEA 2023). Central to this carbon footprint are the technological choices powering aircraft, ships, trains, and vehicles. In the remaining years to 2030, transportation manufacturers must align their technology offering with that required to achieve a 25% reduction in CO2 transport emissions from current levels. For some industries, such as automotive, this means scaling up tested and proven battery technology. For others, like aviation, it involves developing a range of solutions, from efficiency improvements to breakthrough technologies.
The 2024 Automotive and Transportation Manufacturers Benchmark assesses a total of 44 companies operating in the automotive (30) and transportation manufacturers (14) sectors. This benchmark uses two ACT methodologies to assess these companies based on the scope of their activities:
- The ACT Auto methodology applies to companies involved in the design, assembly and sale of ready-to-use light duty vehicles (passenger cars and light commercial vehicles exhibiting a gross vehicle weight lower than 3.5 tonnes). Companies manufacturing vehicle parts but not assembling vehicles themselves are not included in the scope of the methodology.
- The ACT Generic methodology will be used to assess transportation manufacturers, such as companies involved in the design, manufacture and sale of aircraft, ships, trains, and trucks and buses.
For more details about the methodologies used for this benchmark, see Methodology for the 2024 Automotive and Transportation Manufacturers Benchmark.
Approach to scoring and ranking
ACT assessment
A score is given per indicator which is used to calculate the performance element of the ACT score. The narrative assessment is then produced by analysing the company against the four narrative criteria. Data from the performance assessment as well as other verifiable public data on the company such as annual and sustainability reports and news from reliable sources is considered. Finally, the trend score is produced synthesising the forward-looking aspects of the assessment to consider whether the company’s performance would improve, stay the same or worsen if assessed again in the near future.
To create the ACT rating score, a weighting was applied to each of the performance, narrative, and trend scores as follows:
- The performance score has a 1:1 weighting, i.e., a score of 12 is 12;
- The narrative score is weighted: A=20, B=15, C=10, D=5, E=0; and
- The trend score is weighed: “+”=2, “=”=1, “-“= 0.
Social transformation assessment
The just transition methodology is based on 6 indicators (JTI), which are all scaled on 2 points. JTI 1 and JTI 2 are double-weighted while all other ones (from JTI 3 to JTI 6) are single-weighted.
The core social indicators (CSI) are scaled on 1 point. They all are single-weighted, except CSI 4 and CSI 5 which are double-weighted.
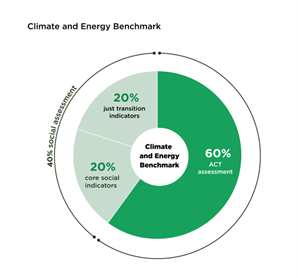
Figure: Total benchmark ranking scores
Aggregation of scores
ACT, CSI and JTI scores are set to 60%, 20% and 20% of the total score respectively. This overall weighted score results in the Oil and Gas Benchmark 2024 ranking.
Total figures for assessments can be subject to rounding differences, but this has not had any overall effect on the ranking.
See FAQData collection process
The Automotive and Transportation Manufacturers Benchmark 2024 assesses the most reliable, latest available, public and verifiable data. Trends in past performance of the company are analysed over five years before the reporting year. Published data until 30 September 2024 was used for the assessment, meaning quantitative datapoints were taken from 2018 to 2023. Data was collected in the first instance from company’s public annual reports and publicly available information, including company websites, sustainability and corporate responsibility reports. Data from the company’s public CDP disclosure was also retrieved and used in the assessment.
Companies were also invited to directly participate in the data validation process by submitting information during a two–week period in October 2024. Companies were invited to provide additional information; 8 companies provided feedback or additional information within the time period.
See data set