
Data Explorer User Guide
Introduction
The WBA Data Explorer is the central hub for accessing detailed performance data on the world's most influential companies. It provides comprehensive benchmarking data on 2,000 companies (the SDG2000) and their progress towards the United Nations Sustainable Development Goals.
The Data Explorer allows users to:
- Browse and filter company data across multiple dimensions
- Access detailed benchmark scores and methodology information
- Download data in structured formats for further analysis
- Integrate WBA data directly into your own systems via our REST API
Beta Release
The WBA Data Explorer is currently in Beta. This means:
- The platform is fully functional but may undergo changes based on user feedback
- Some features may be refined or expanded over time
- We welcome your feedback to help us improve the experience
Data Sources
All data available in the WBA Data Explorer is publicly sourced. The information we provide is obtained from documents and reports published by the companies themselves, including annual reports, sustainability reports, company websites, and other public disclosures. Each data point is traceable to its source document.
Relationship to the WBA Website
Some of the data available in the Data Explorer can also be found on the main WBA website. However, the Data Explorer provides access to a more comprehensive dataset, including detailed methodology information, granular assessment data, and evidence sources that are not available on the website.
Who is this for?
The Data Explorer serves a diverse range of stakeholders:
- Researchers and academics seeking comprehensive corporate sustainability data for analysis
- Investors and financial analysts evaluating company performance on ESG criteria
- Policy makers tracking corporate progress on sustainable development
- Companies (both assessed and non-assessed) benchmarking performance against peers
- Civil society organizations monitoring corporate accountability
- Journalists investigating corporate sustainability claims
What data is available?
The Data Explorer provides access to three main categories of data:
Company Data — Core information about the SDG2000 companies, including identifiers, industry classifications, geographic attributes, emissions data, climate profiles, and climate-related targets.
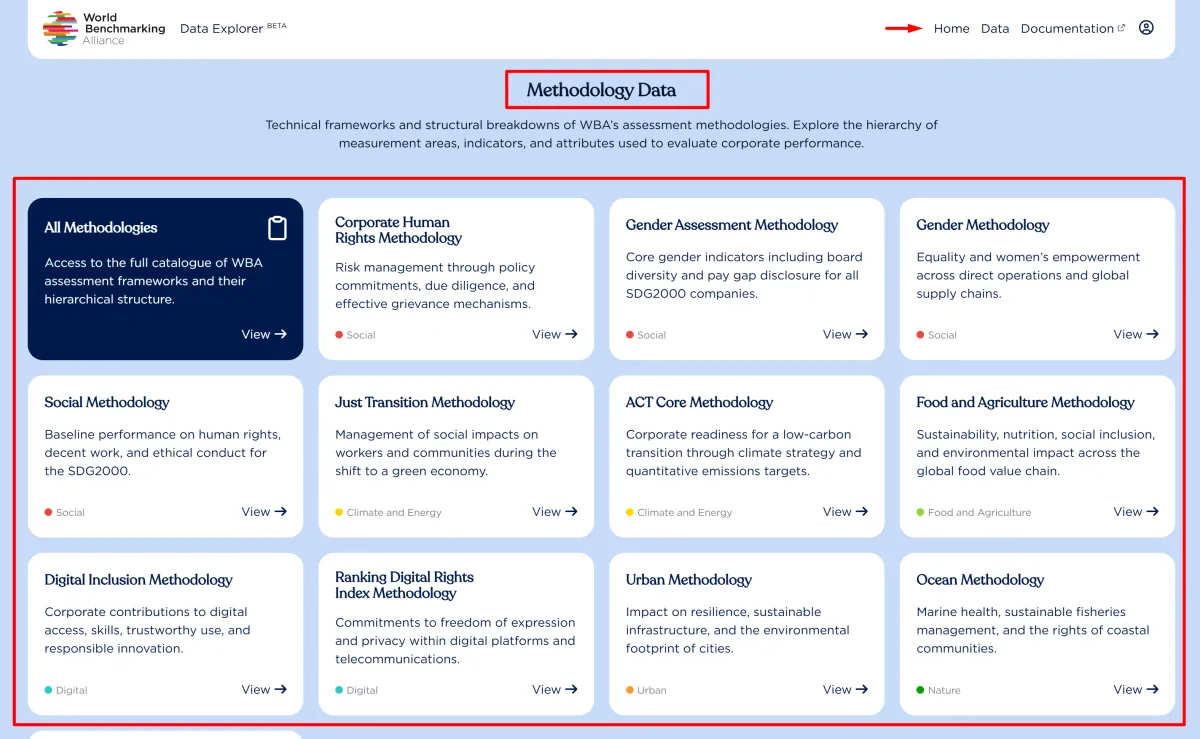
Methodology Data — The assessment framework structure, including measurement areas, indicators, elements, and attributes that define how companies are evaluated.
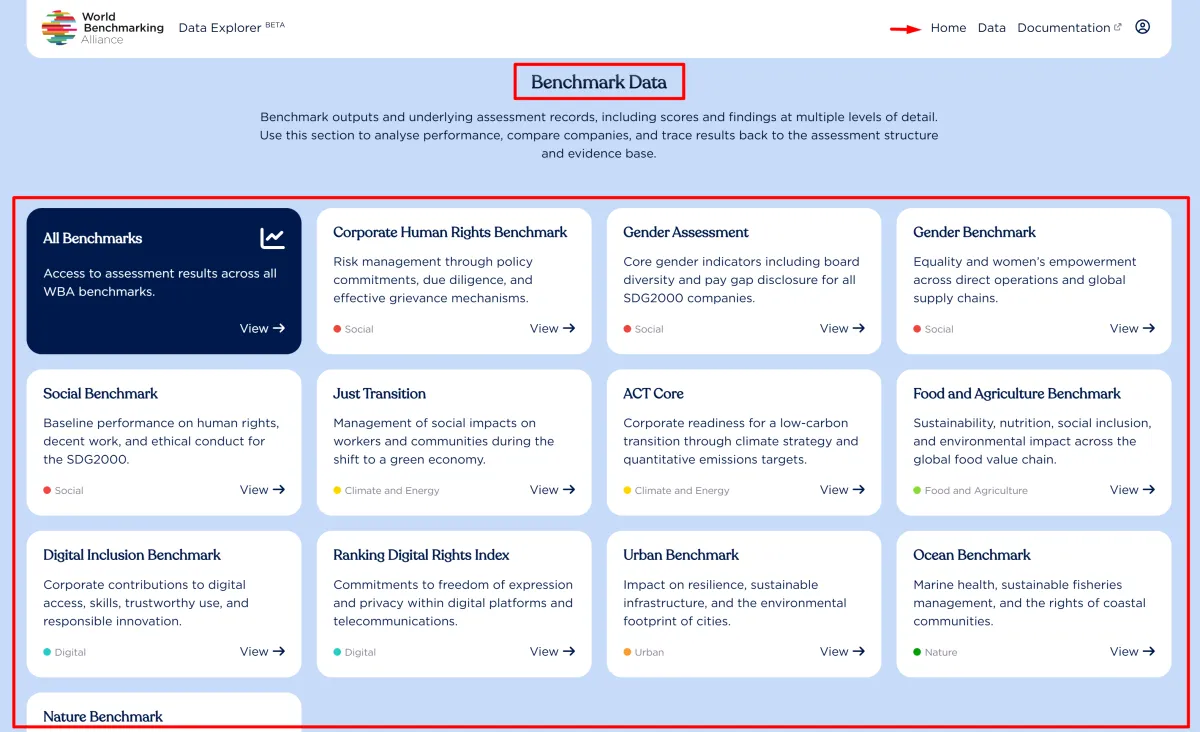
Benchmark Data — Actual assessment results, including scores at multiple levels of granularity from overall benchmark scores down to individual attribute values.
About WBA Benchmarks
The World Benchmarking Alliance produces benchmarks across multiple thematic areas:
Social Transformation
- Social Benchmark
- Gender Benchmark
- Corporate Human Rights Benchmark
Climate and Energy
- ACT Core Benchmark
- Just Transition Benchmark
Nature and Food Systems
- Food and Agriculture Benchmark
- Nature Benchmark
- Ocean Benchmark
Digital Systems
- Digital Inclusion Benchmark
- Ranking Digital Rights Index
Urban Systems
- Urban Benchmark
Each benchmark assesses companies using a structured methodology organized into measurement areas, indicators, elements, and attributes.
Getting Started
Accessing the Data Explorer
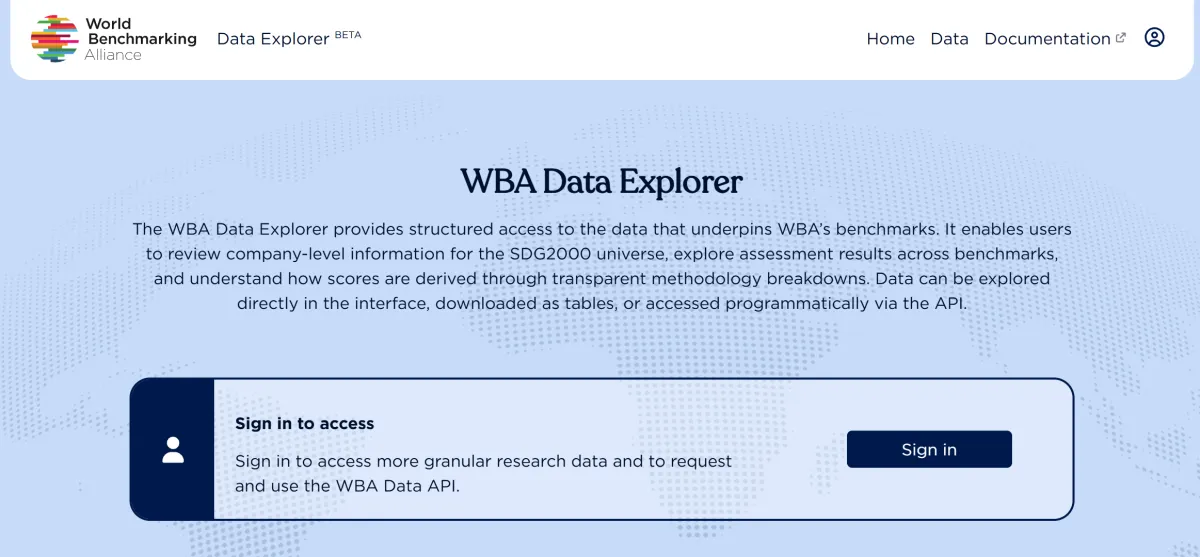
The WBA Data Explorer is available at: data.worldbenchmarkingalliance.org
Creating an Account
Registration is required to access the Data Explorer. To create an account:
- Click Sign In on the portal homepage
- Click Don't have an account yet? Register
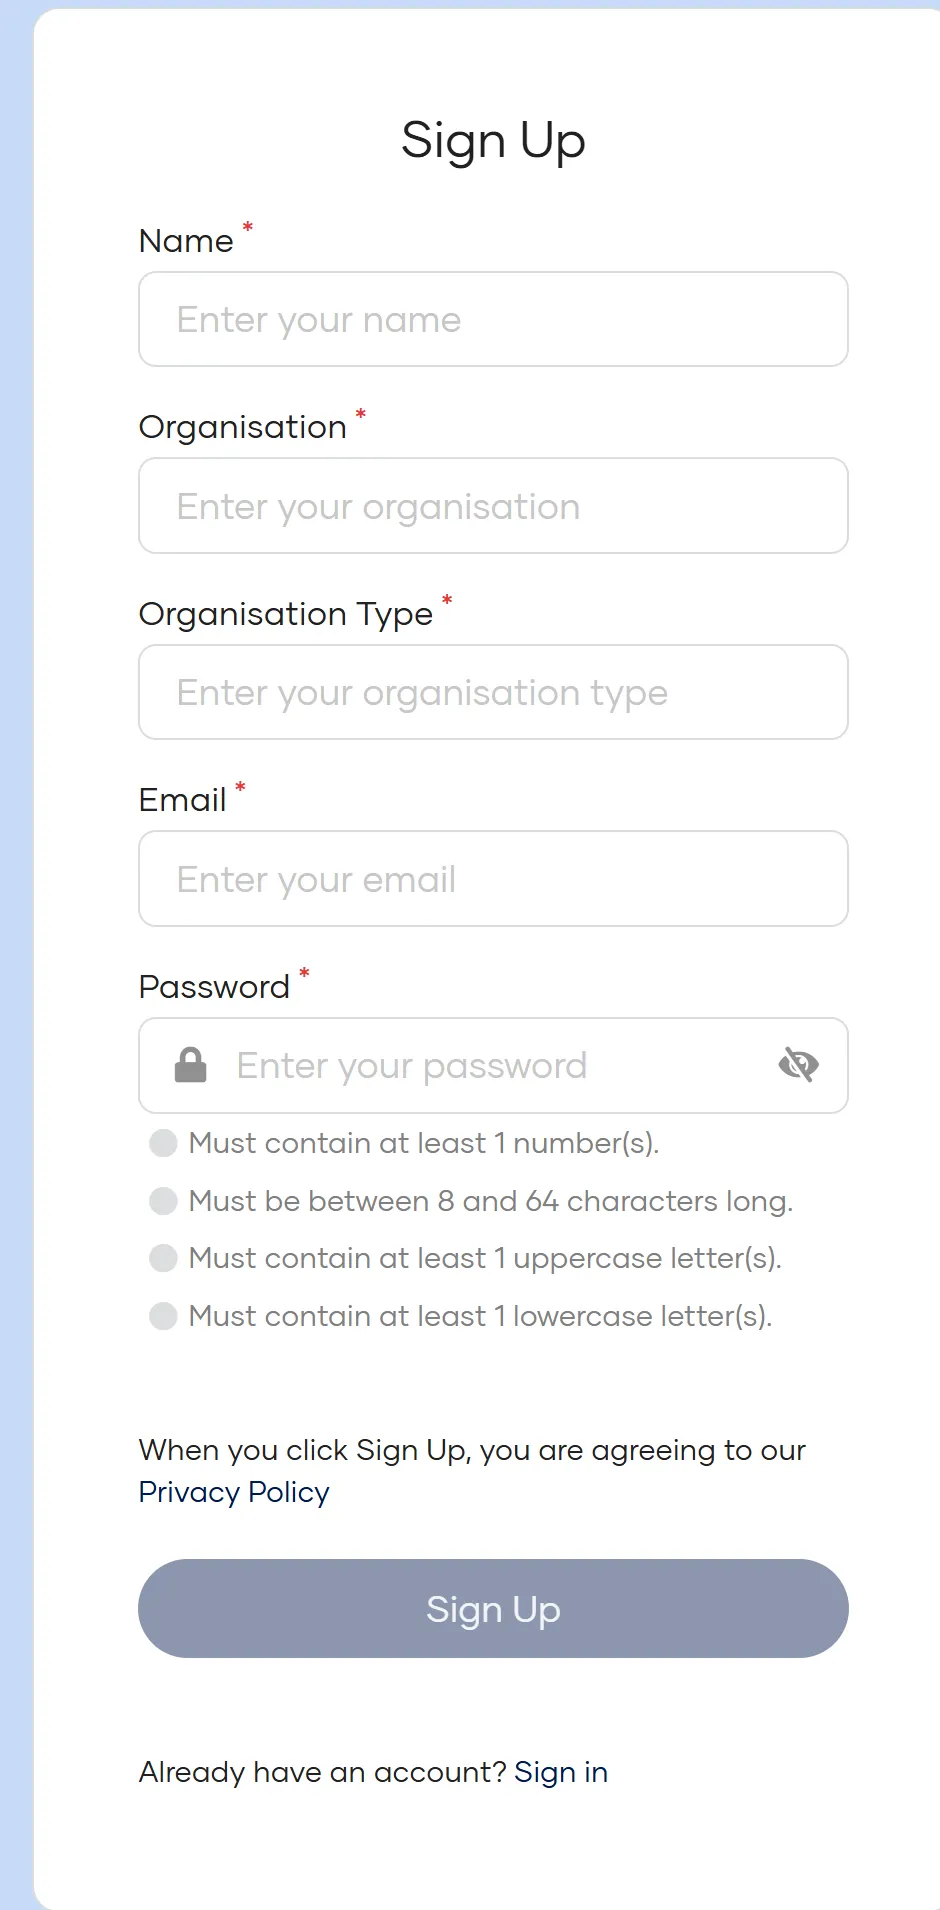
- Complete the registration form:
- Name — Your full name
- Organisation — The name of your organisation
- Organisation Type — Select from the dropdown list
- Email — Your email address
- Password — Create a secure password
- Click Sign Up to submit (this confirms your acceptance of the Terms of Use and Privacy Policy)
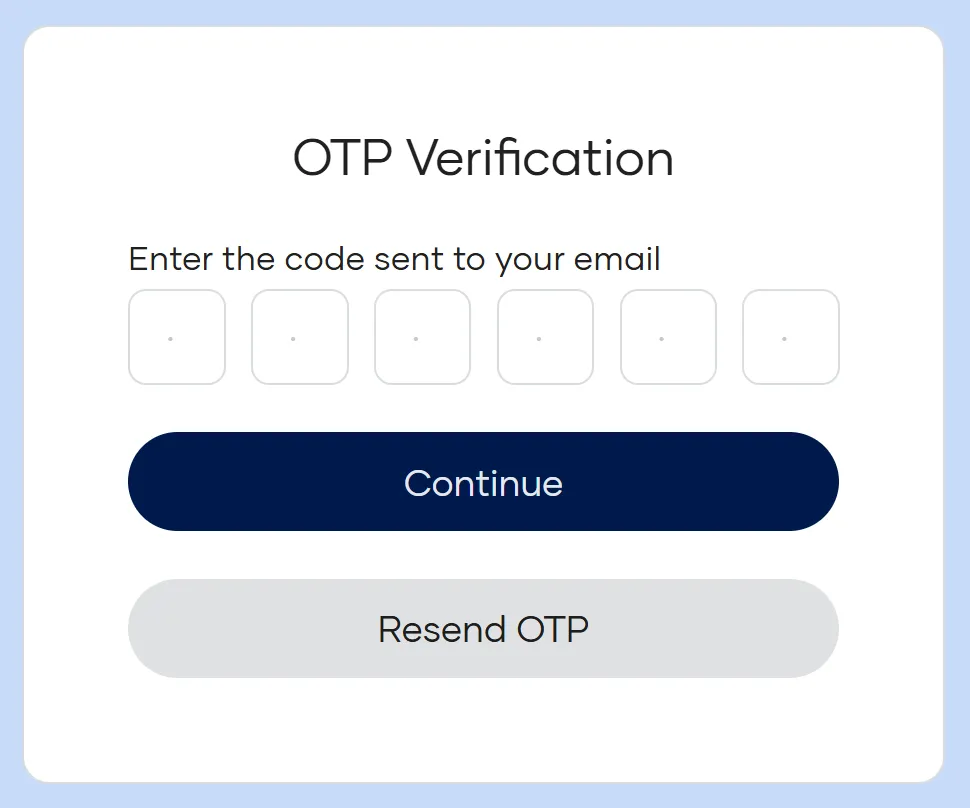
- You will be redirected to a verification screen
- Check your email for a 6-digit verification code
- If you do not receive it within a few minutes, check your spam folder
- You can request a new code if needed
- Enter the verification code to complete registration
Once registered, you can sign in at any time using your email and password.
Signing In
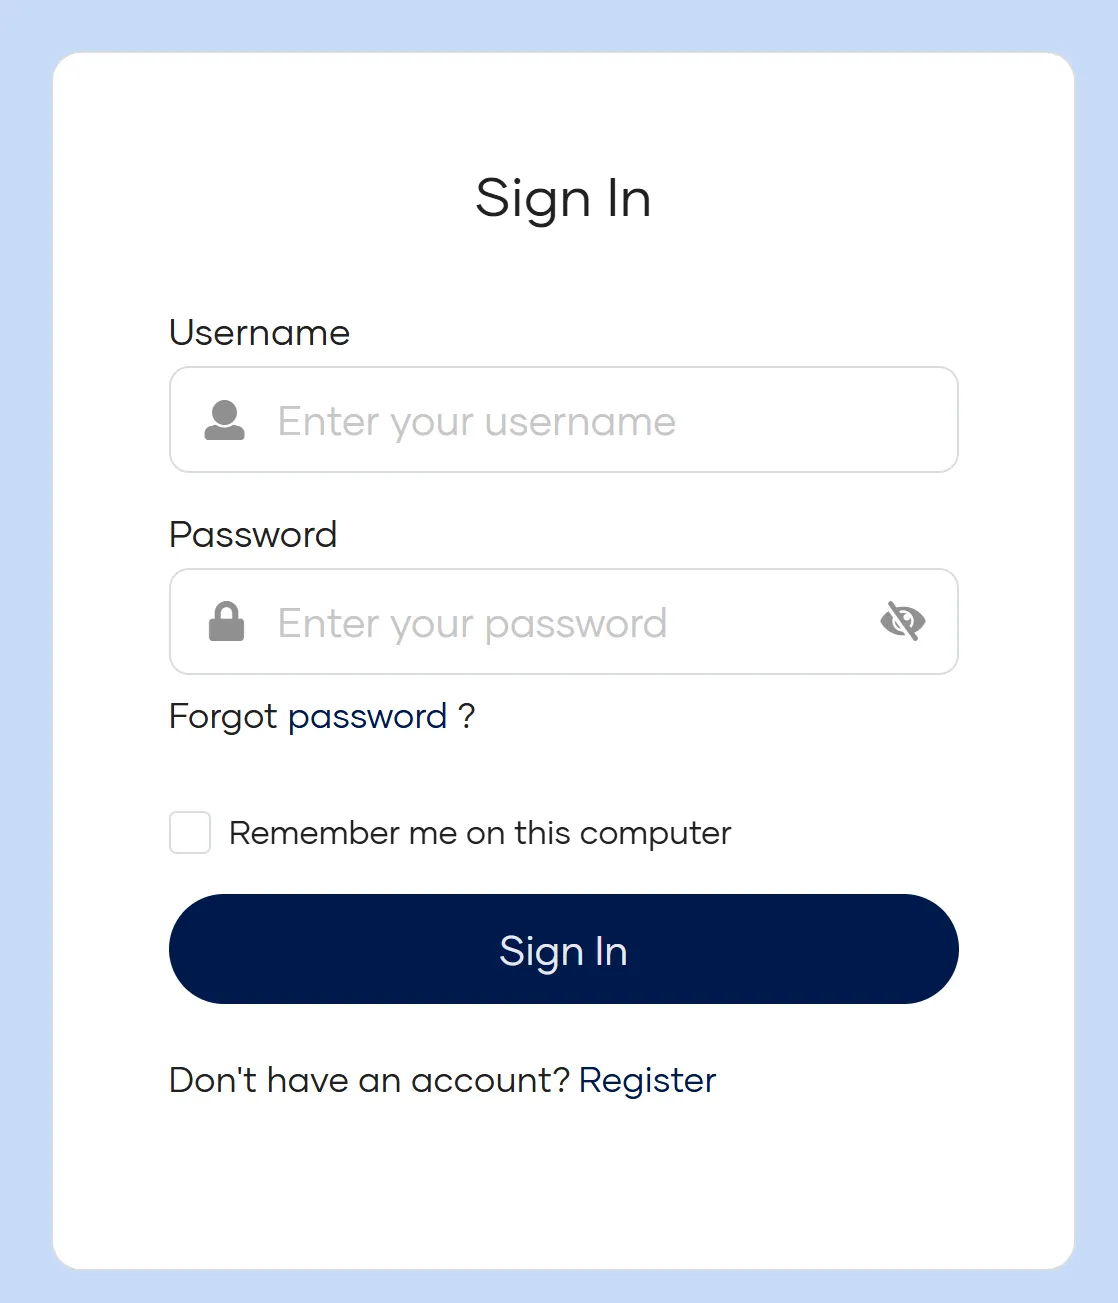
If you already have an account:
- Click Sign In in the top navigation bar
- Enter your email and password
- Click Sign In to access the portal
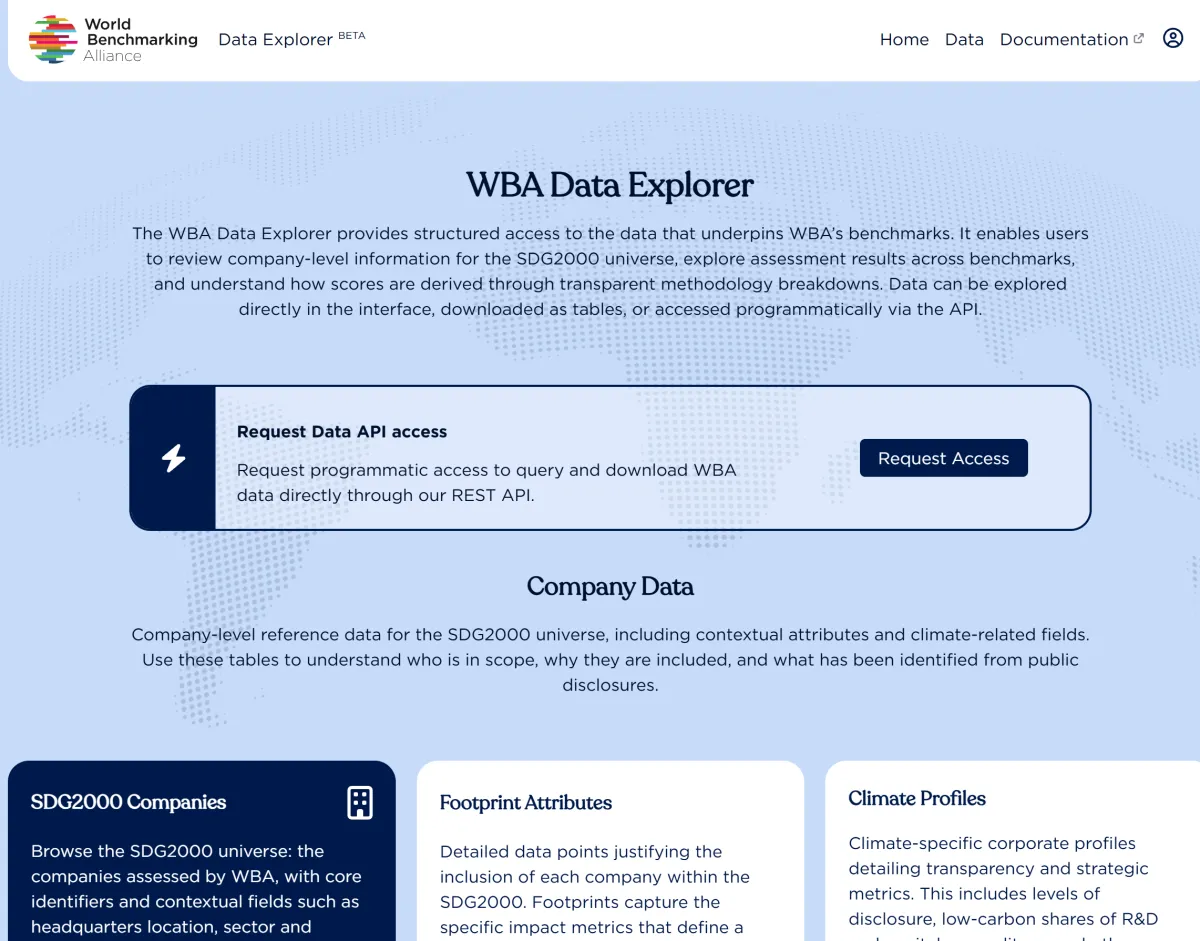
Portal Overview
Once signed in, you will see:
- Navigation bar — Links to Home, Data, and Documentation
- Welcome section — Introduction to the portal with API access request option
- Data sections — Three main areas: Company Data, Methodology Data, and Benchmark Data
- Data tiles — Quick access cards to specific datasets within each section
First Steps
- Explore the homepage — Review the available data categories and datasets
- Click on a data tile — Navigate to any dataset that interests you
- Browse the data — Use the data section to explore records
- Apply filters — Narrow down results using the filtering options
- Download — Export the datasets you need
Navigating the Explorer
Understanding the Data Structure
The Data Explorer organizes information into three main tabs, each containing multiple datasets.
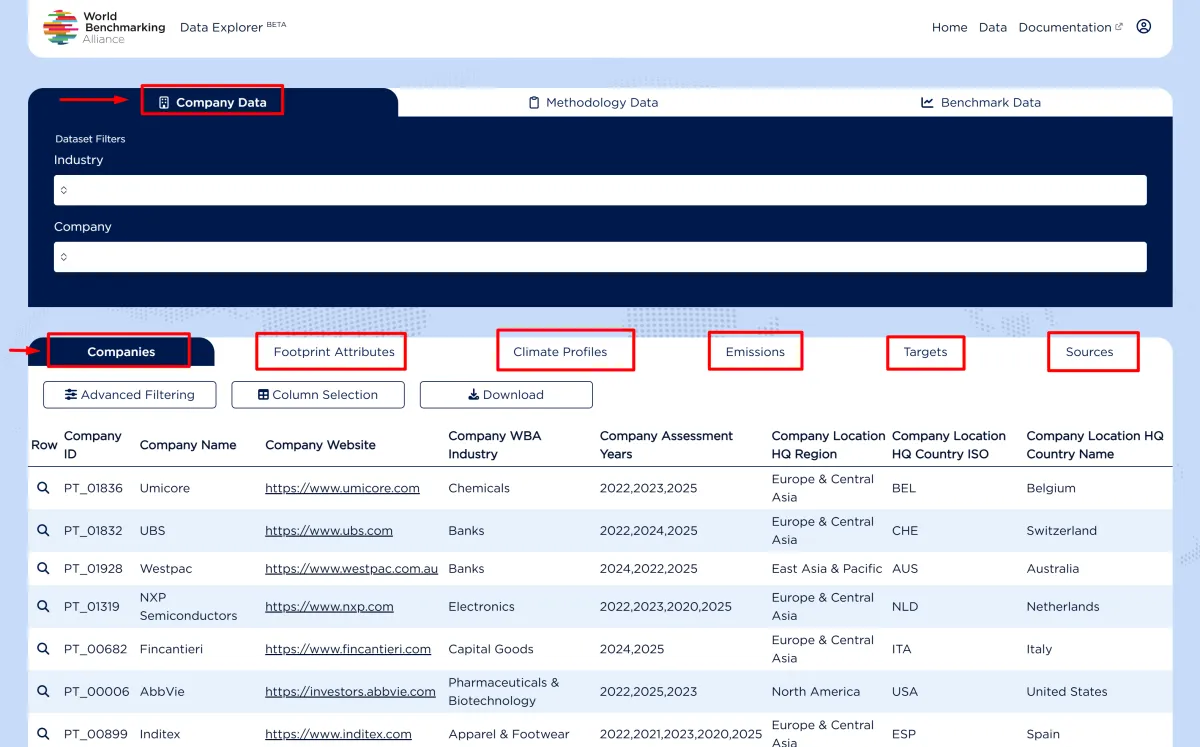
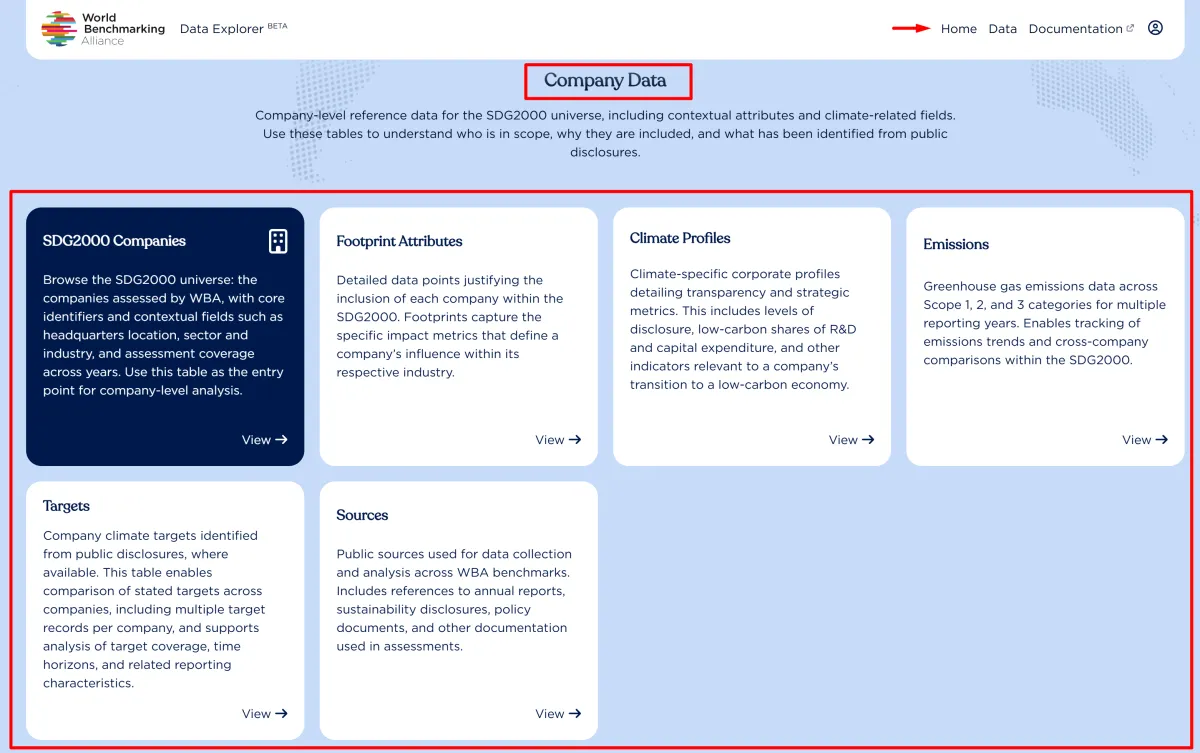
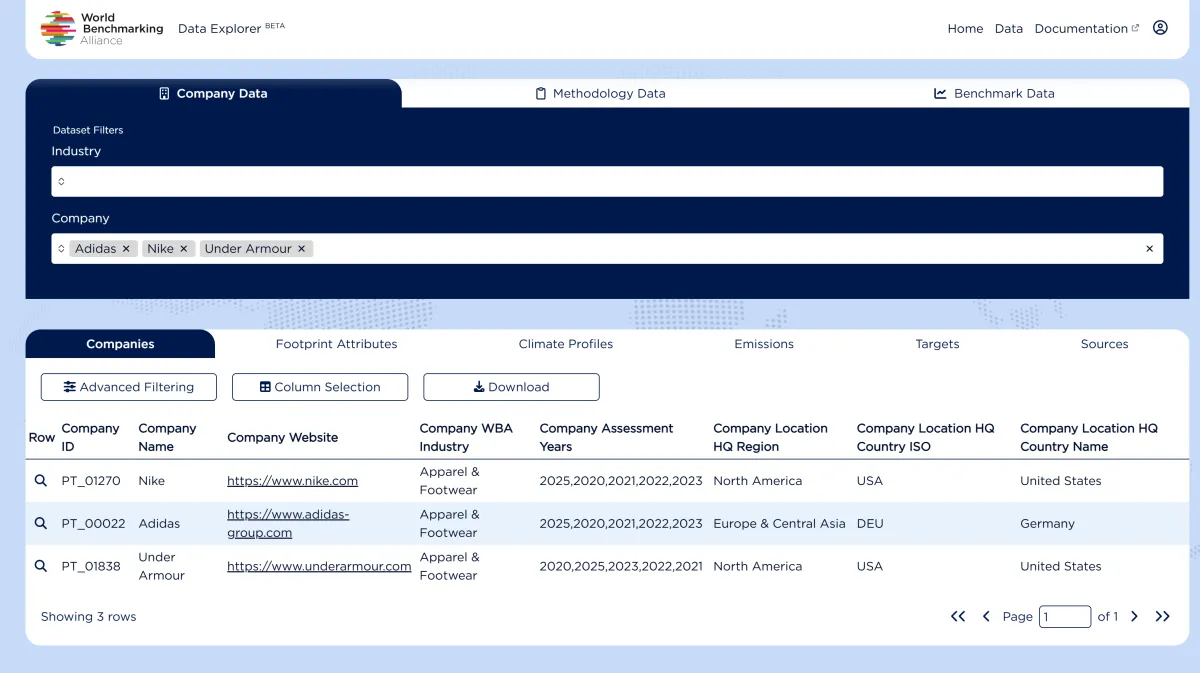
Company Data
Company Data provides foundational information about the companies in our benchmarks. It contains six datasets:
Companies — Core company information including identifiers (ISIN, LEI), industry classification, geographic location.
Footprint Attributes — Company characteristics such as size, sector-specific metrics, and operational footprint data.
Climate Profiles — Climate-related company information including science-based targets status and net-zero commitments.
Emissions — Greenhouse gas emissions data including Scope 1, 2, and 3 emissions where available.
Targets — Climate-related targets set by companies including emissions reduction goals and timelines.
Sources — References to the documents and reports used as evidence.
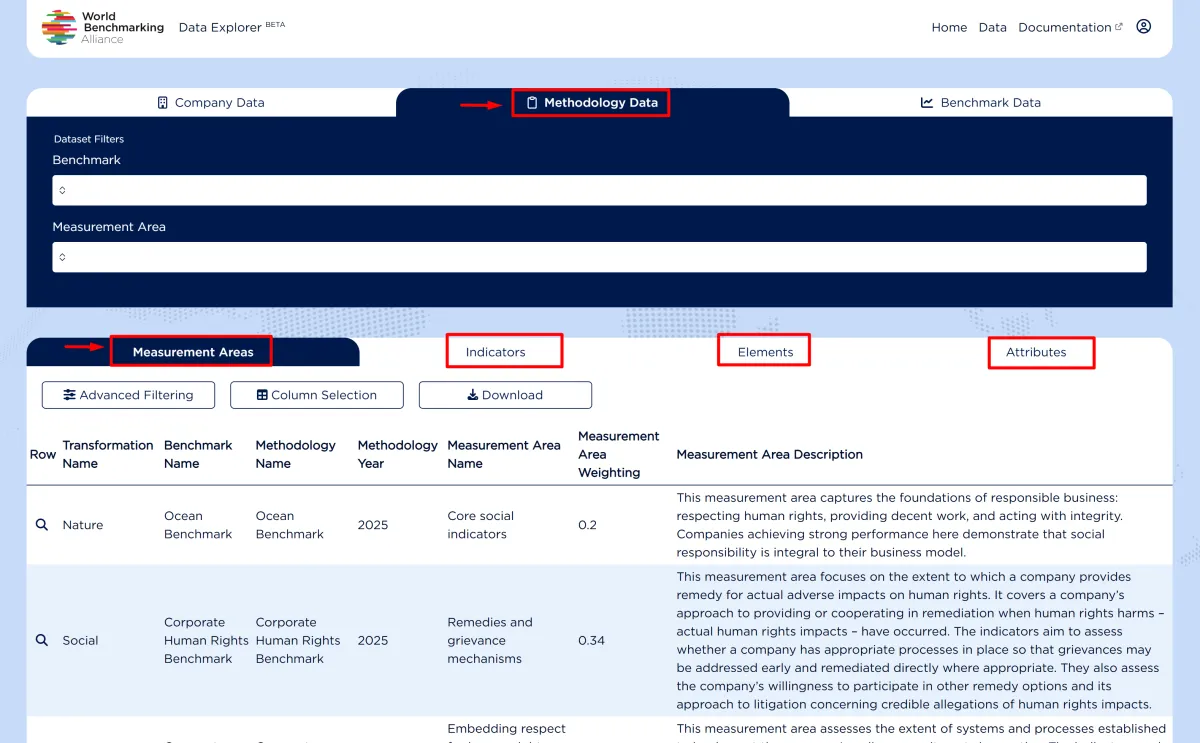
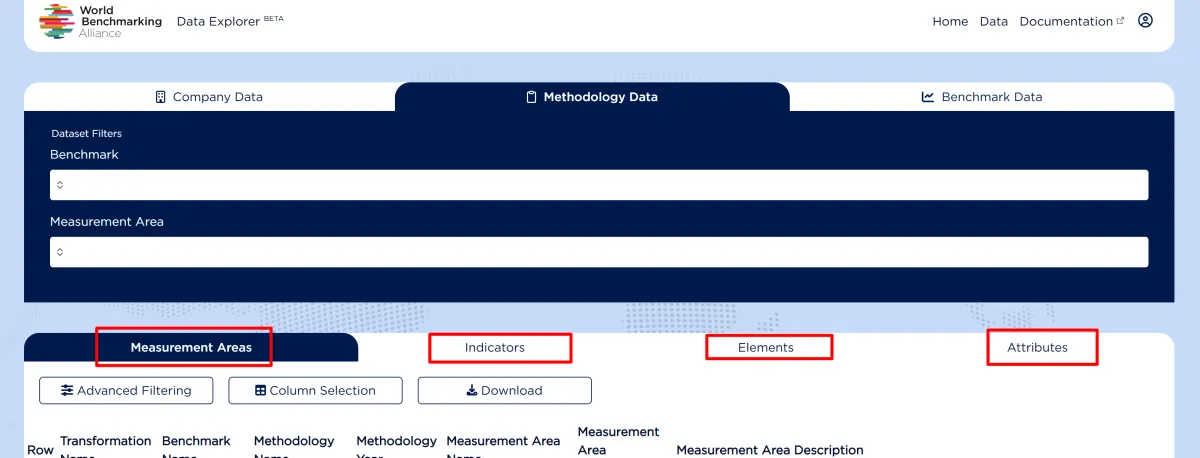
Methodology Data
Methodology Data explains the structure of our assessment frameworks. It contains four datasets:
Measurement Areas — The highest level of the methodology hierarchy, representing broad thematic areas of assessment.
Indicators — Specific aspects being measured within each measurement area.
Elements — Detailed components that make up each indicator.
Attributes — The most granular level — individual data points or metrics that inform the element assessments.
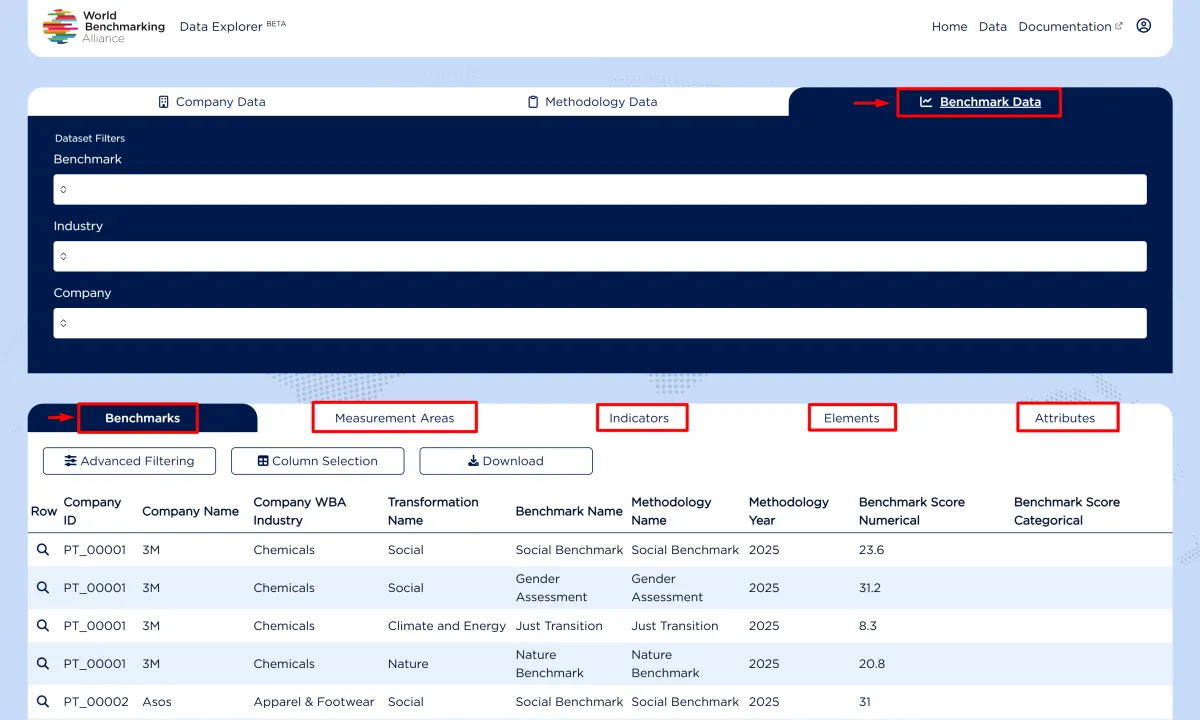
Benchmark Data
Benchmark Data contains the actual assessment results. It contains five datasets:
Benchmarks — Overall benchmark scores for each company by benchmark and year.
Measurement Areas — Company scores at the measurement area level.
Indicators — Company scores at the indicator level.
Elements — Company scores at the element level.
Attributes — Individual attribute values with supporting the element assessments.
Data Hierarchy
The data follows a hierarchical structure that flows from general to specific:
Company
  └── Benchmark Score
        └── Measurement Area Scores
              └── Indicator Scores
                    └── Element Scores
                          └── Attribute Values
Navigating Between Datasets
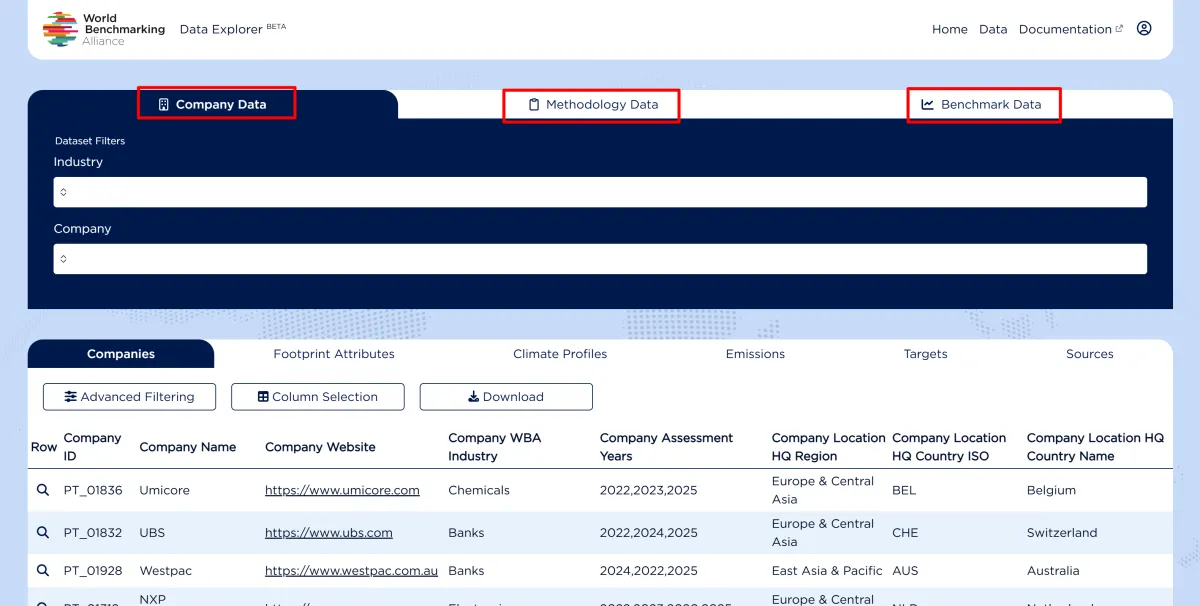
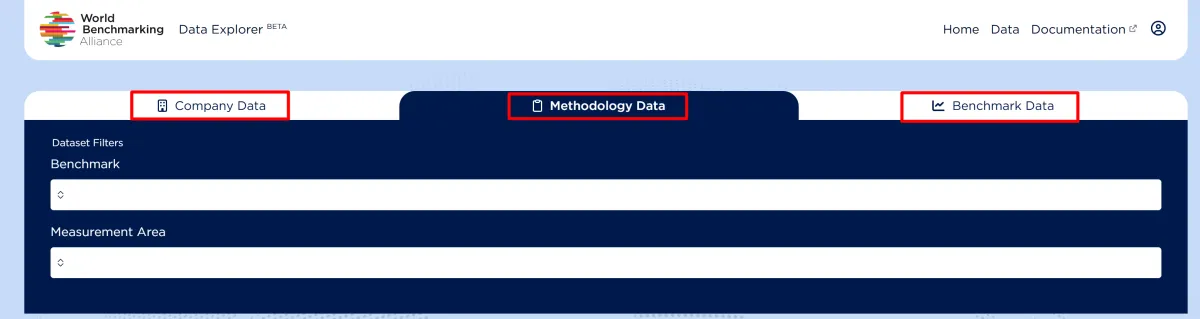
From the main Data view, you can switch between the three main tabs using the tab bar:
- Company Data
- Methodology Data
- Benchmark Data
Within each tab, you can navigate between datasets using the sub-tabs below the filters.
Filtering and Downloading Data
Filtering Data
The Data Explorer provides multiple ways to filter and refine your data view.
Tab-level Filters
Located at the top of each tab, tab-level filters allow you to narrow down data across all datasets within that section.
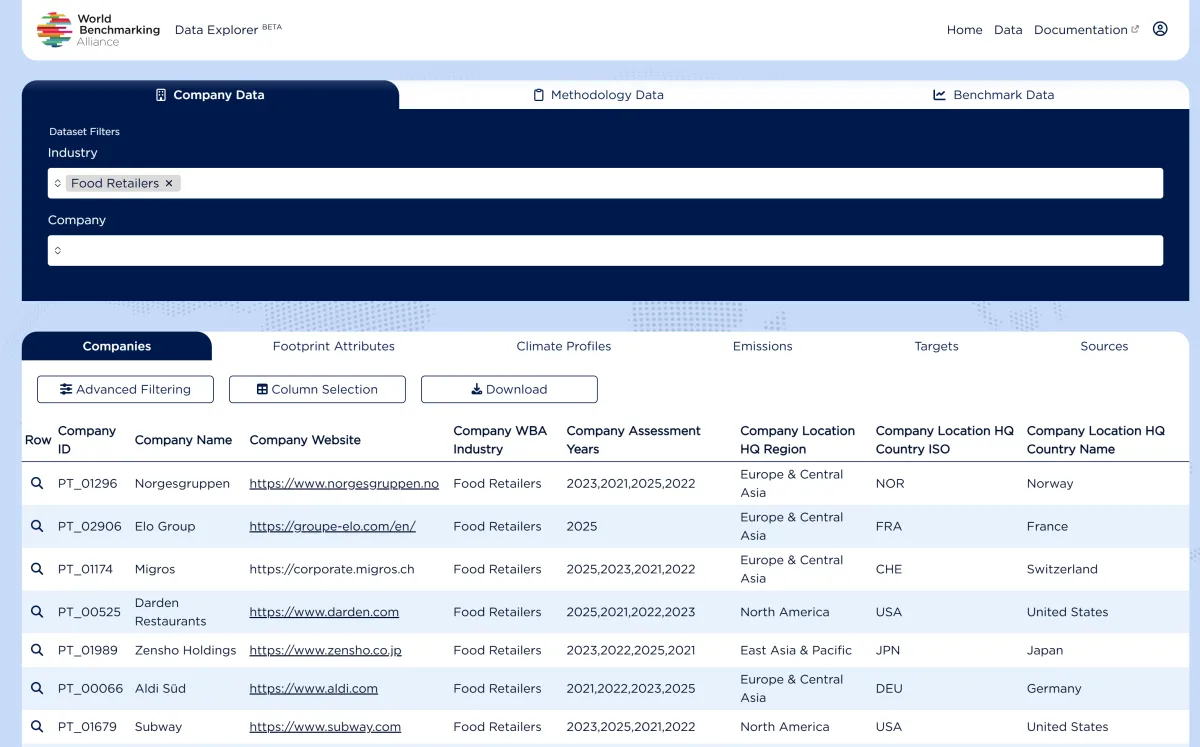
Company Data filters: Industry, Company
Methodology Data filters: Benchmark
Benchmark Data filters: Benchmark, Industry, Company
To apply a filter:
- Click on the filter dropdown
- Select one or more values
- The data table will automatically update
To clear filters:
- Click the "×" next to a selected filter value, or
- Clear all filters using the reset option
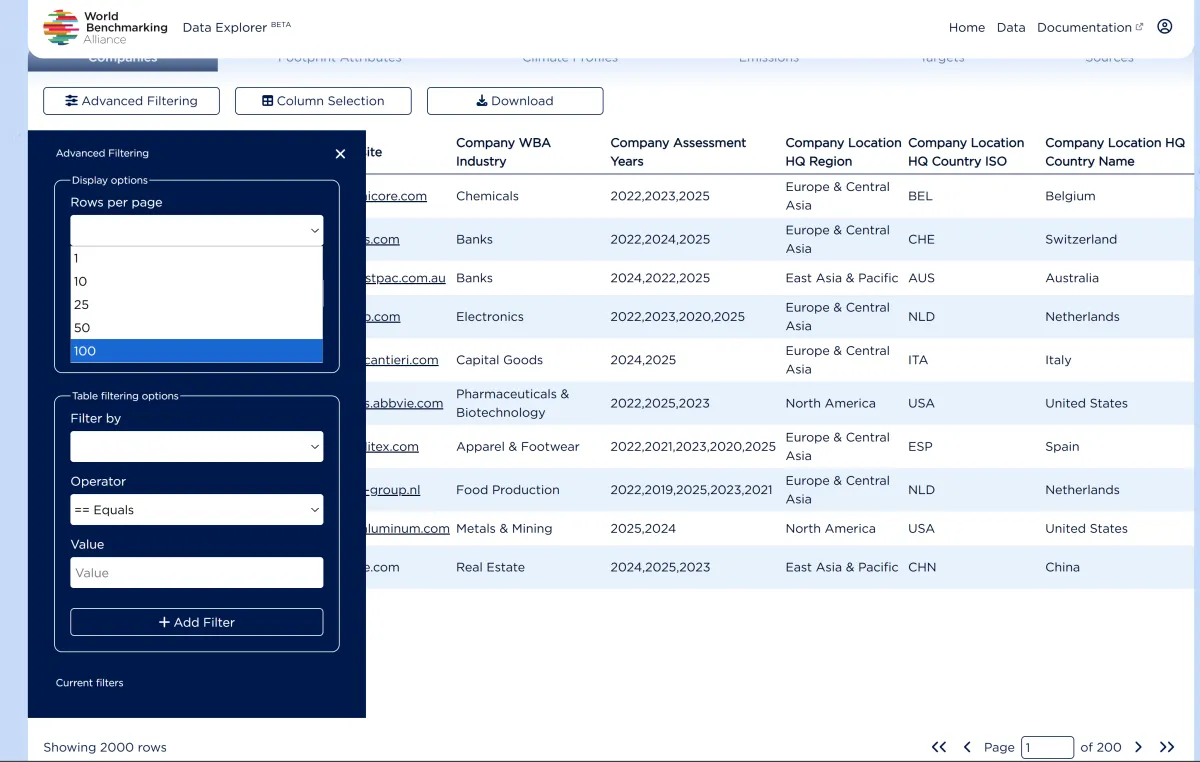
Advanced Filtering
For more precise control, click Advanced Filtering to access additional options:
Rows per page — Control how many records display per page (1, 10, 25, 50, or 100)
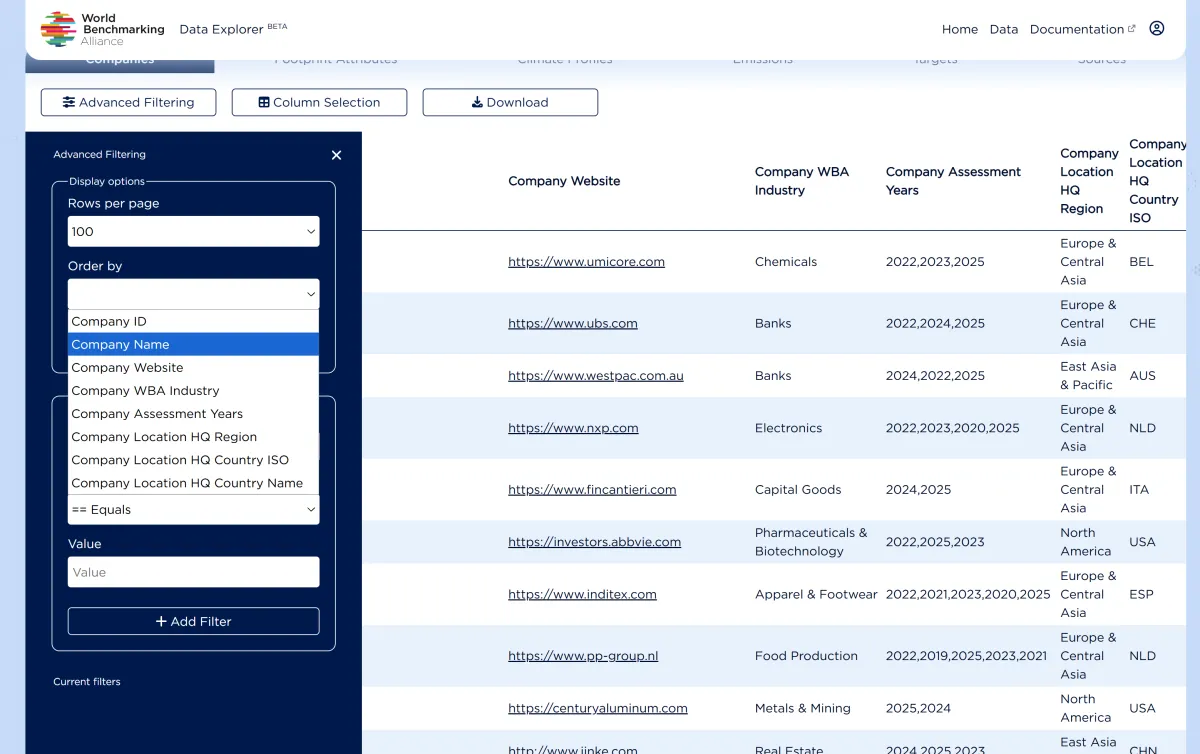
Order by — Sort data by any selected column in ascending or descending order
Filter by — Apply column-specific filters using operators (equals, contains, greater than, etc.)
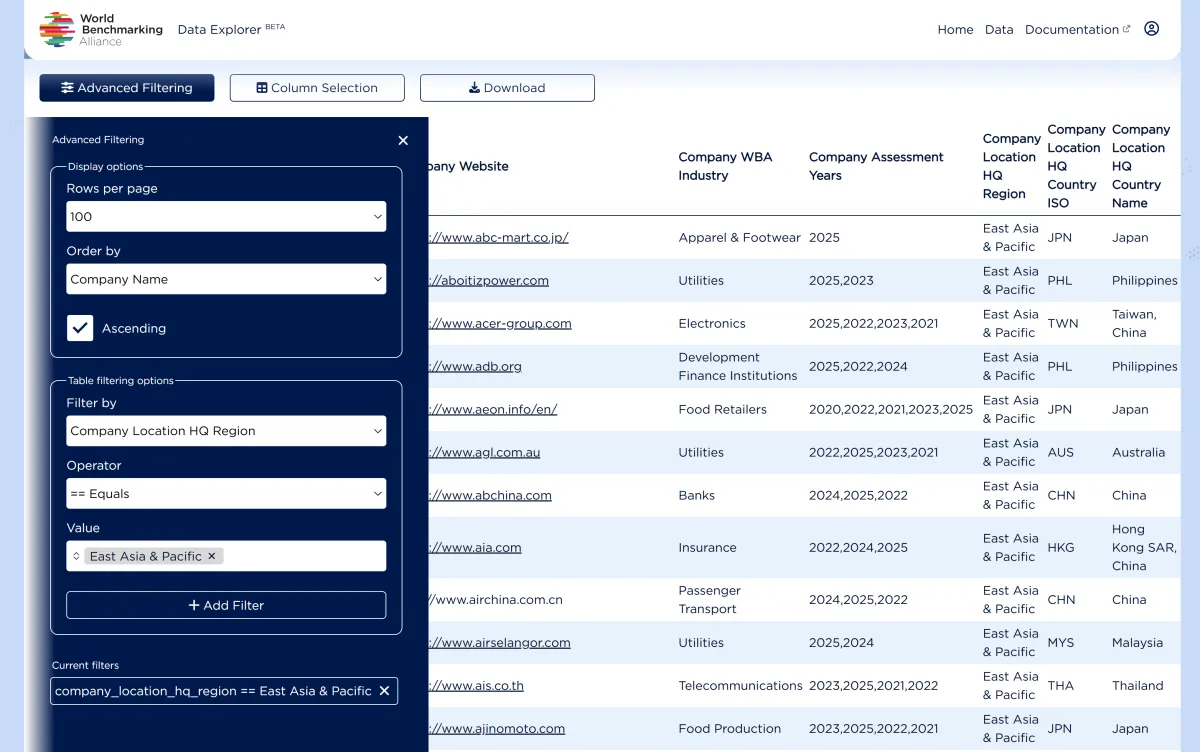
To add an advanced filter:
- Click Advanced Filtering
- Select a column from the "Filter by" dropdown
- Choose an operator (e.g., "== Equals", "Contains")
- Enter a value
- Click + Add Filter
Multiple filters can be combined. Active filters appear under "Current filters" and can be removed individually.
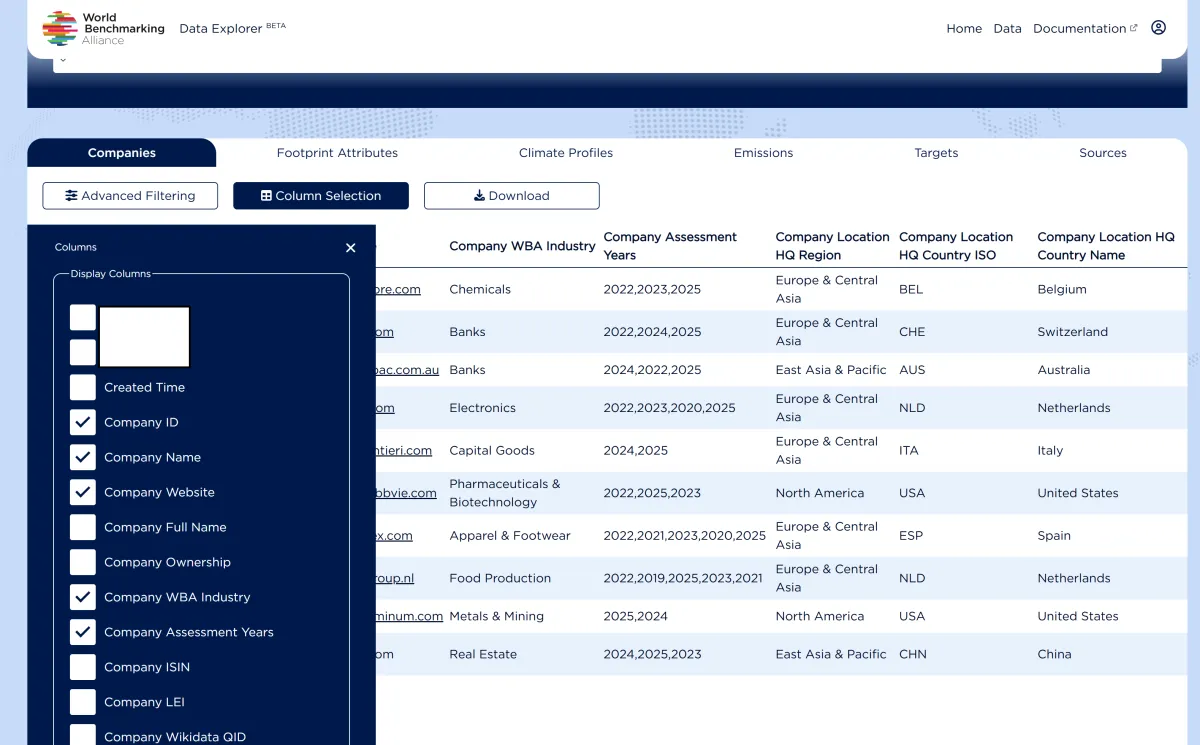
Selecting Columns
Not all columns are displayed by default. To customize which columns appear in the table view:
- Click Column Selection
- Check or uncheck columns to show or hide them
- Click outside the panel to apply changes
This is particularly useful when working with datasets that have many fields, allowing you to focus on the data most relevant to your needs.
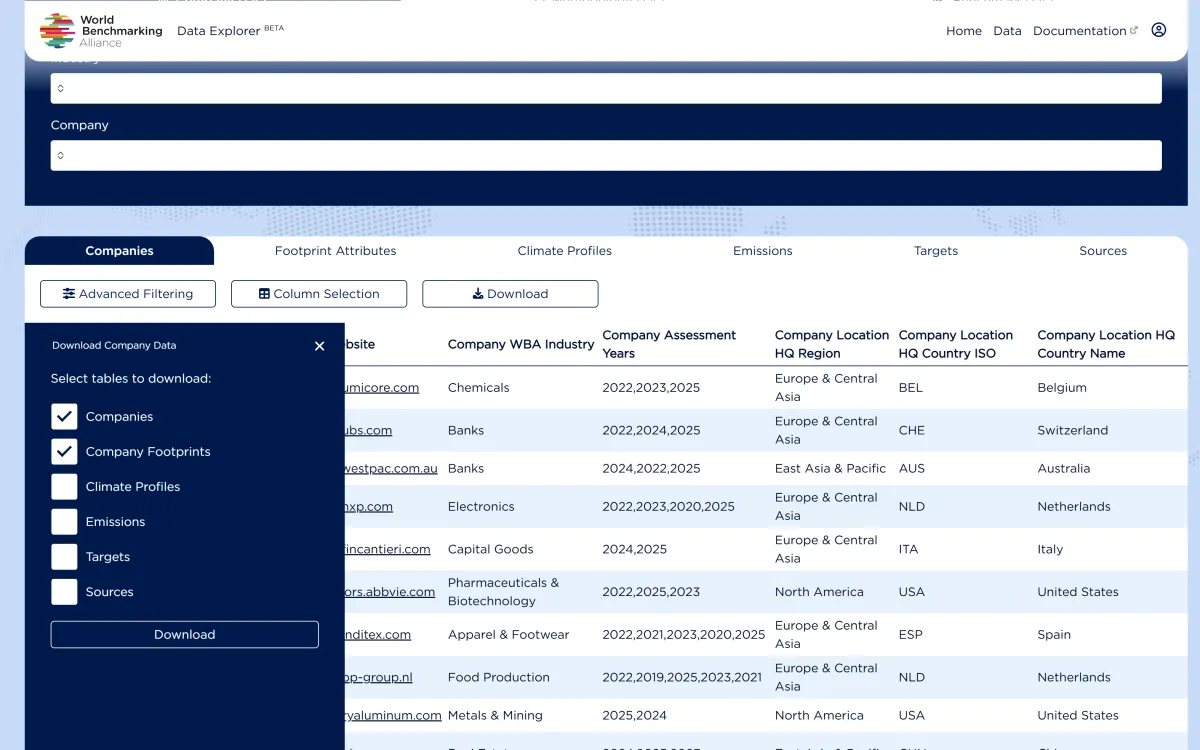
Downloading Data
To download data from the Data Explorer:
- Navigate to the dataset you want to download
- Click the Download button
- Select the tables you want to include (multiple tables are available within each tab)
- Click Download
Downloaded files are provided as compressed archives (.zip) containing CSV files.
Notes: Downloads include the complete dataset for the selected tables, and they will reflect any global filters applied across datasets (e.g., Company / Benchmark / Methodology-level filters). The current version does not support downloading a subset based on advanced table filters, nor does it support custom column selection. Advanced filters and column selections apply only to the on-screen view.
Download Options
When downloading Company Data, as an example, you can select which tables to include:
- Companies
- Company Footprints
- Climate Profiles
- Emissions
- Targets
- Sources
This allows you to download only the level of detail you need.
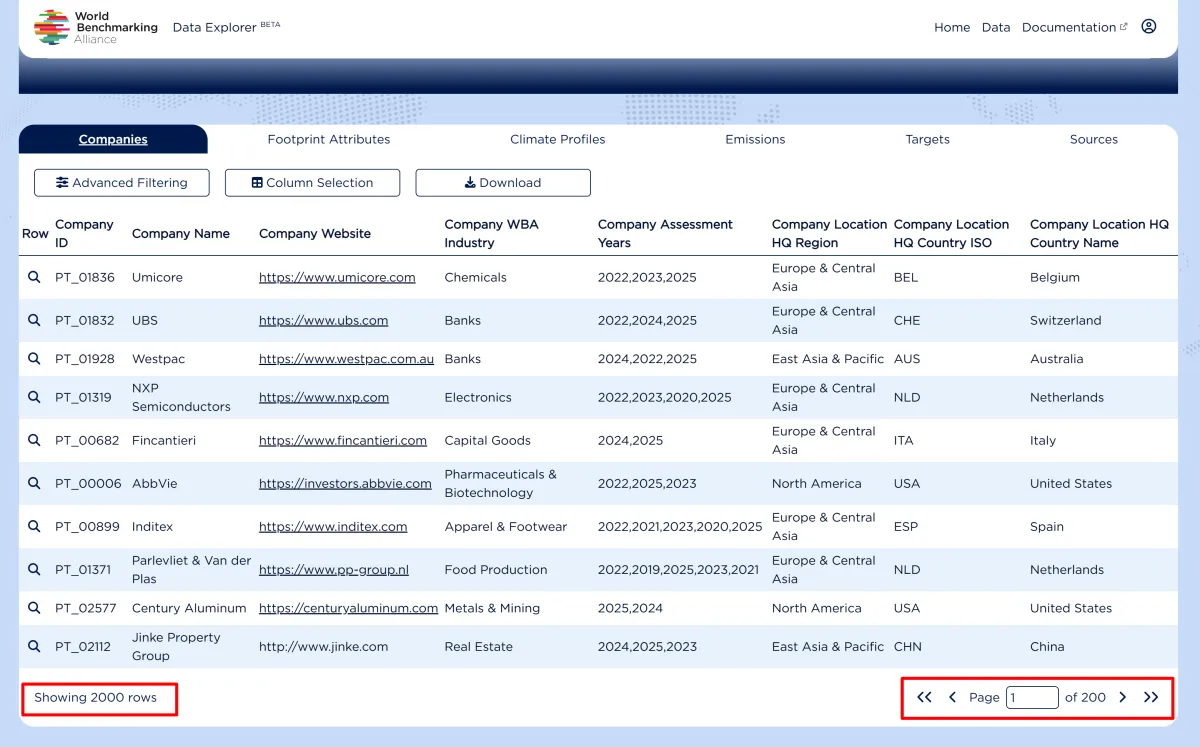
Pagination
All dataset tables are paginated. At the bottom of each data table, you will see:
- Total number of rows matching your current filters
- Page navigation controls (first, previous, next, last)
- Current page number and total pages
Documentation
The Documentation section provides comprehensive resources to help you make the most of the Data Explorer. You can access it from the navigation bar at the top of the portal.
What you will find
User Guide — You are here. Step-by-step instructions for navigating the portal, filtering data, and downloading datasets.
API Documentation — Technical reference for developers who want to access WBA data programmatically. Includes authentication, endpoints, query parameters, and example requests.
Data Dictionary — Detailed definitions for all fields available in the Data Explorer. Essential for understanding what each data point represents and how to interpret the data correctly.
WBA Glossary — Definitions of key terms and concepts used across WBA benchmarks and assessments, such as "SDG2000", "Measurement Area", "Indicator", and more.
Data Updates
Update Frequency
WBA benchmark data follows an annual assessment cycle. Each benchmark:
- Assessment period — Companies are assessed during a defined period each year
- Publication — Final scores are published with the benchmark launch
- Data availability — Published data becomes available in the Data Explorer
Once published, benchmark data is not modified unless exceptional circumstances.
Contact and Support
If you have any questions, encounter any issues, or need assistance with the Data Explorer or API, please contact us at:
We welcome your feedback and suggestions to help us improve the platform.
FAQs
Q: Do I need an account to use the Data Explorer?
A: Yes, registration is required to access the Data Explorer. Creating an account is free and only requires your email address, password, and basic information about yourself and your organisation.
Q: How often is the data updated?
A: Benchmark data is published annually with each benchmark cycle. Once published, data is not modified.
Q: Is this the same data as on the WBA website?
A: The Data Explorer provides access to more comprehensive data than what is available on the main WBA website, including detailed methodology information, granular assessment data, and evidence sources.
Q: What is the SDG2000?
A: The SDG2000 is a list of approximately 2,000 companies identified as most influential in achieving the UN Sustainable Development Goals, based on their revenue, assets, and sectoral impact.
Q: Where does the data come from?
A: All data in the Data Explorer is publicly sourced from documents and reports published by the companies themselves, including annual reports, sustainability reports, company websites, and other public disclosures.
Q: Why is some data missing for certain companies?
A: Not all companies are assessed in every benchmark. Additionally, some metrics may not be applicable or disclosed for certain companies.
Q: What does the benchmark score represent?
A: Benchmark scores typically range from 0 to 100 and represent a company's overall performance against the benchmark methodology. Higher scores indicate stronger performance on the assessed criteria.
Q: What is the difference between Methodology Data and Benchmark Data?
A: Methodology Data describes the assessment framework (what is measured and how). Benchmark Data contains the actual results (company scores and evidence).
Q: What format is the downloaded data in?
A: Data is downloaded as CSV files within a compressed (.zip) archive.
Q: Can I download a filtered view of the data?
A: Currently, downloads include the complete dataset. Filters and column selections apply only to the on-screen view. This functionality may be added in a future release.
Q: How do I report an error in the data explorer?
A: Please contact the WBA team at [email protected] with details about the data issue you have identified.
Subscribe to stay informed on our work
Keep up to date with all the latest from World Benchmarking Alliance
