


Ocean Benchmark
Safeguarding oceans and marine life by assessing companies’ actions to halt and reverse marine ecosystem loss.
We measure how the world’s leading companies contribute to the sustainable management of our oceans and coastal ecosystems and ensure responsible social practices are implemented.

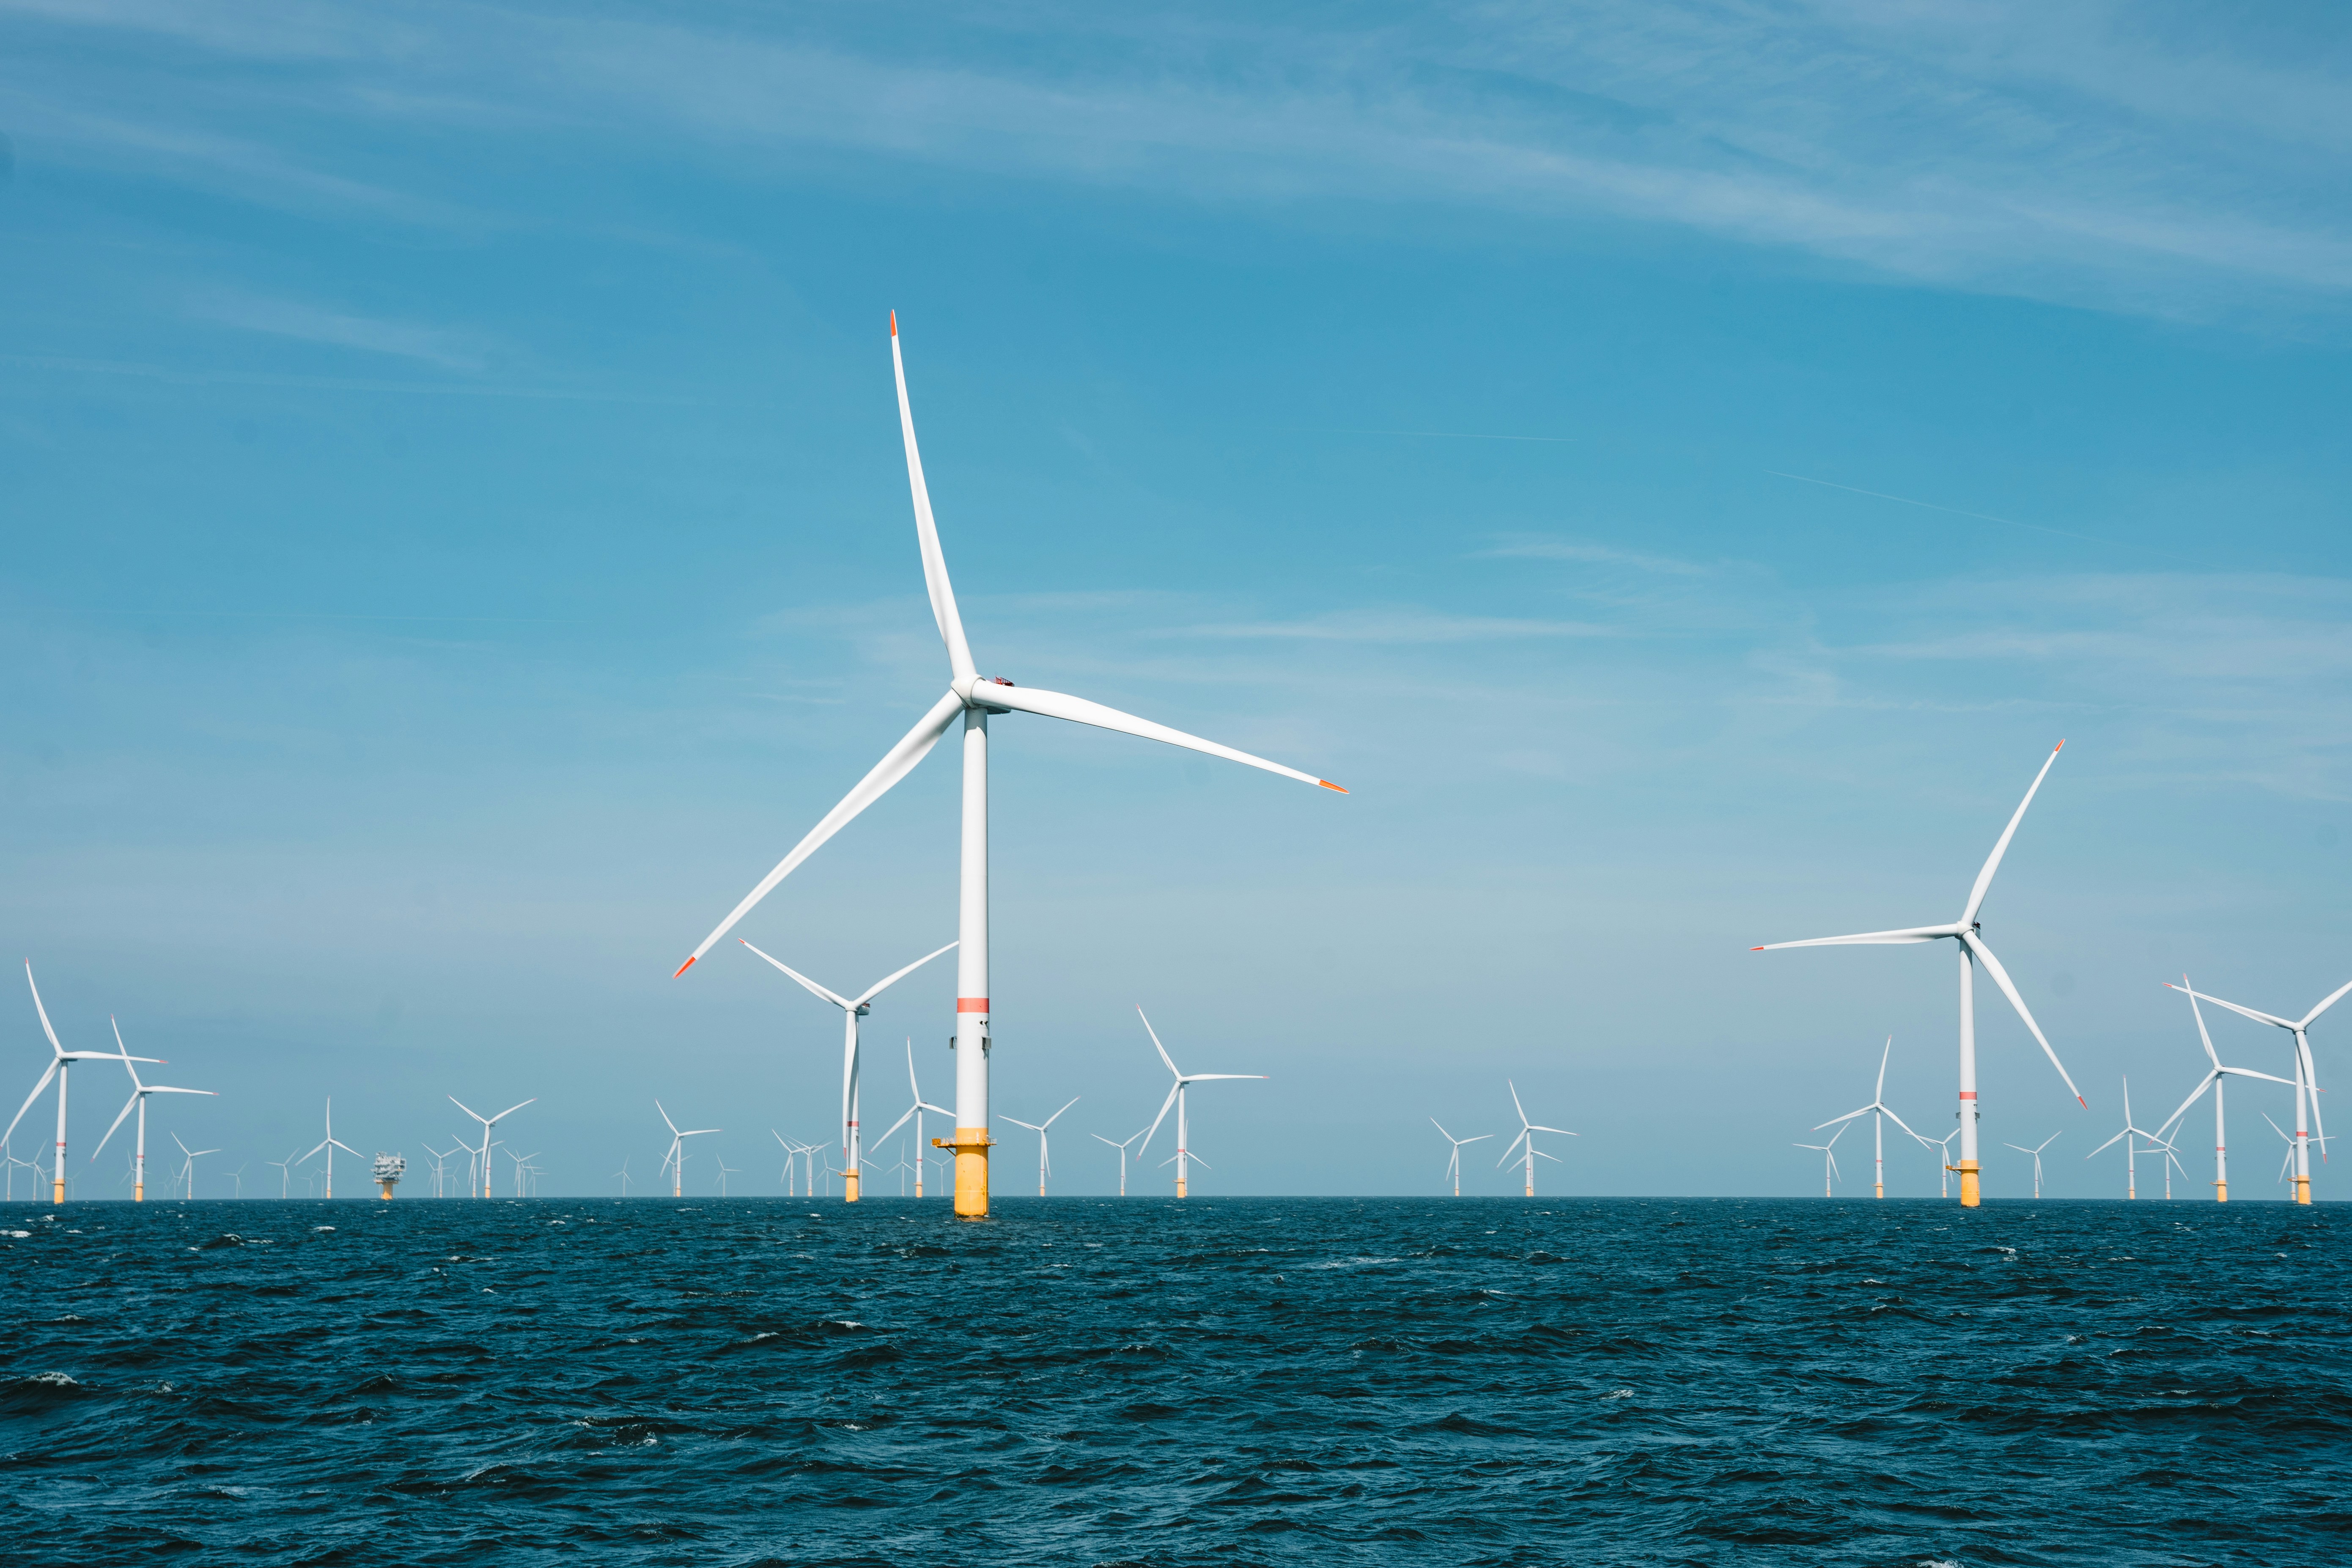
Offshore wind and seafood emerge as the best-performing ocean sectors
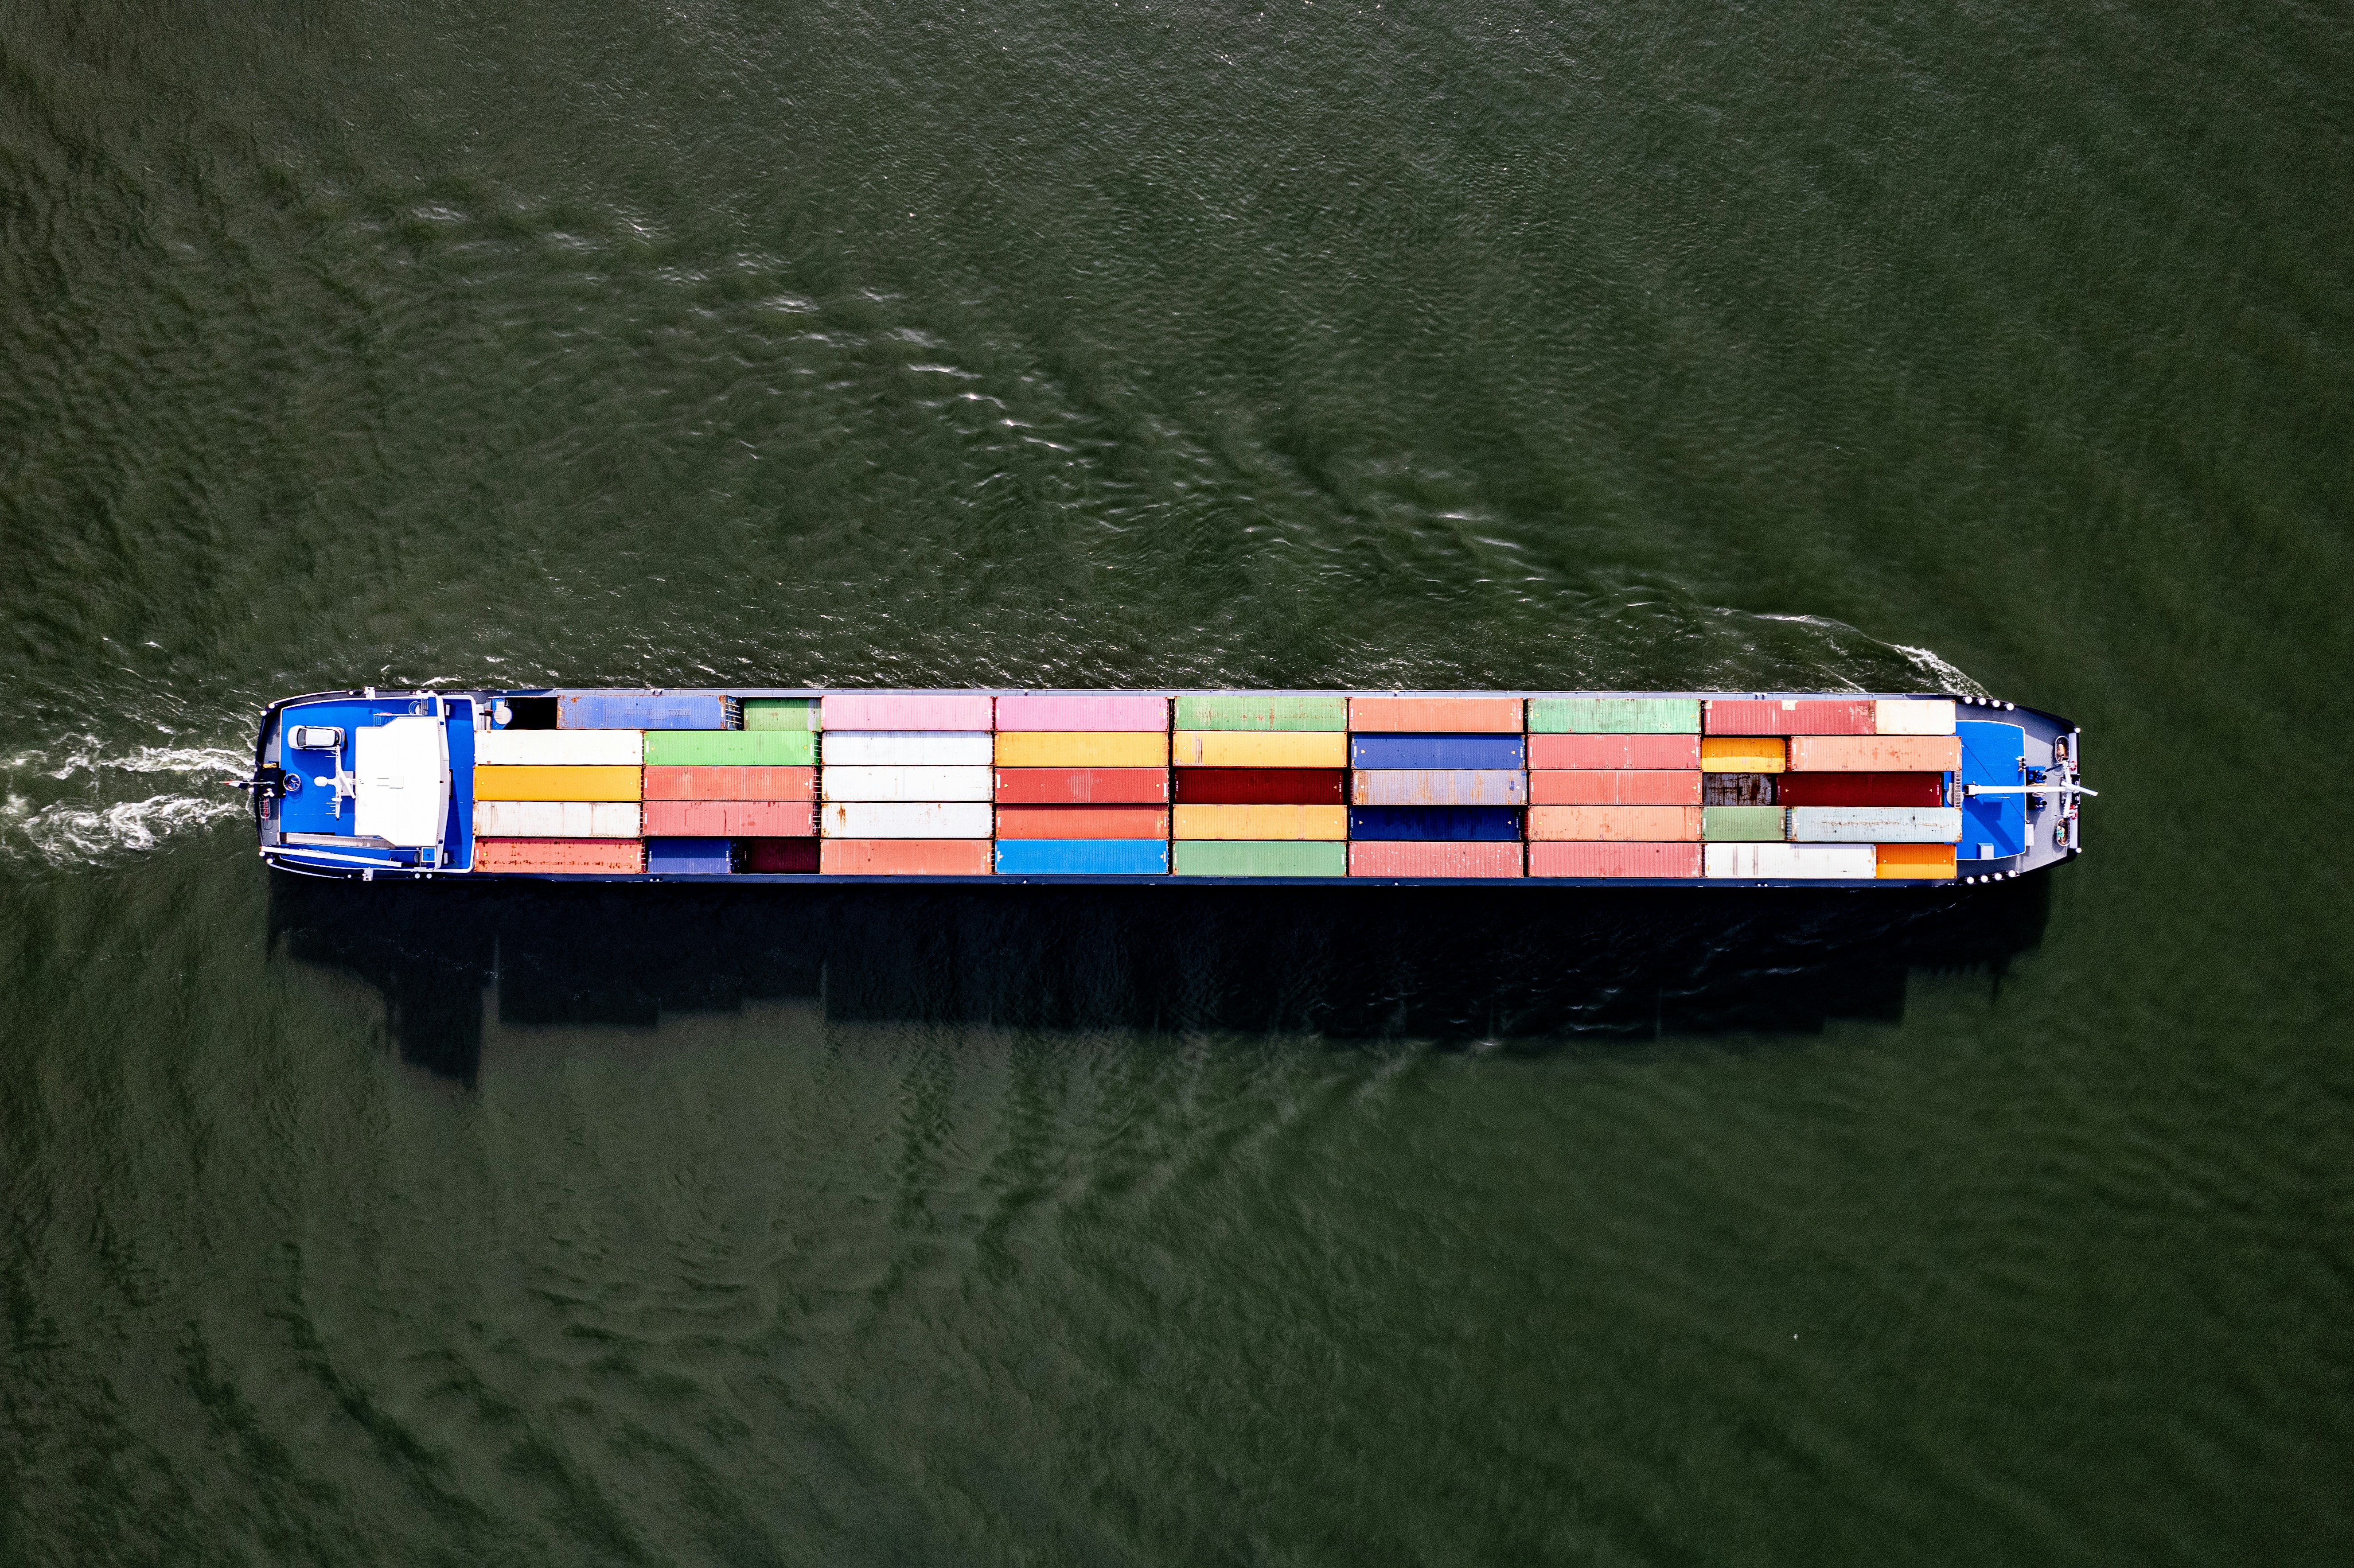
On average, across all social, environmental, and governance indicators, offshore wind and seafood emerge as the best-performing ocean sectors, with average scores of 28/100 and 21/100, respectively. In contrast, shipbuilding and repair is the weakest-performing ocean sector, with an average score of 11/100. Notably, the seafood sector also shows the widest spread of scores, indicating substantial variation in performance within the sector.
European companies lead on performance for both ocean and land-based sectors
Across both land- and ocean-based sectors, leading companies are predominantly based in Europe and the East Asia & Pacific region. This pattern is also evident within ocean sectors, where European companies achieve an average score of 23/100, followed by East Asia & Pacific companies at 18/100, while North American companies lag behind with an average score of 11/100.
Climate-related impacts are more widely addressed by ocean companies than ocean-specific impacts
Companies most frequently focus on measuring their impacts rather than setting targets or reporting progress across nearly all topics. Among the topics assessed, GHG emissions emerge as the most commonly addressed area, with 53% of companies measuring GHG emissions and 40% setting targets for GHG emissions. Other topics, including plastic use, water conservation, and water pollution, show a lower level of engagement. Targets and progress reporting remain limited overall, particularly for issues such as oil spills, erosion, and marine biodiversity loss.

Land-based sectors lead on social responsibility, but offshore wind companies outperform all others
On average, land-based sectors including food retailers, chemicals and construction and materials outperform ocean sectors on core social responsibility indicators, though offshore wind leads overall. On social issues, high-risk ocean sectors such as seafood, cruise tourism, and shipbuilding lag behind comparable high-risk land-based sectors like apparel.

Land-based sectors are more advanced than ocean sectors in measuring their nature-related impacts, risks, and dependencies
Land-based sectors perform equally to ocean sectors in terms of impacts on ecosystems and biodiversity, both scoring around 18/100 on those indicators. Ocean sectors lead in addressing certain ocean-specific impacts, such as marine habitats, while land-based companies are more advanced in measuring their nature-related impacts, risks, and dependencies.

Ocean Benchmark latest


Access this data
Explore the latest data, download for further analysis or integrate into your own workflows using our API.

Subscribe to stay informed on our work
Keep up to date with all the latest from World Benchmarking Alliance
