


Nature Benchmark
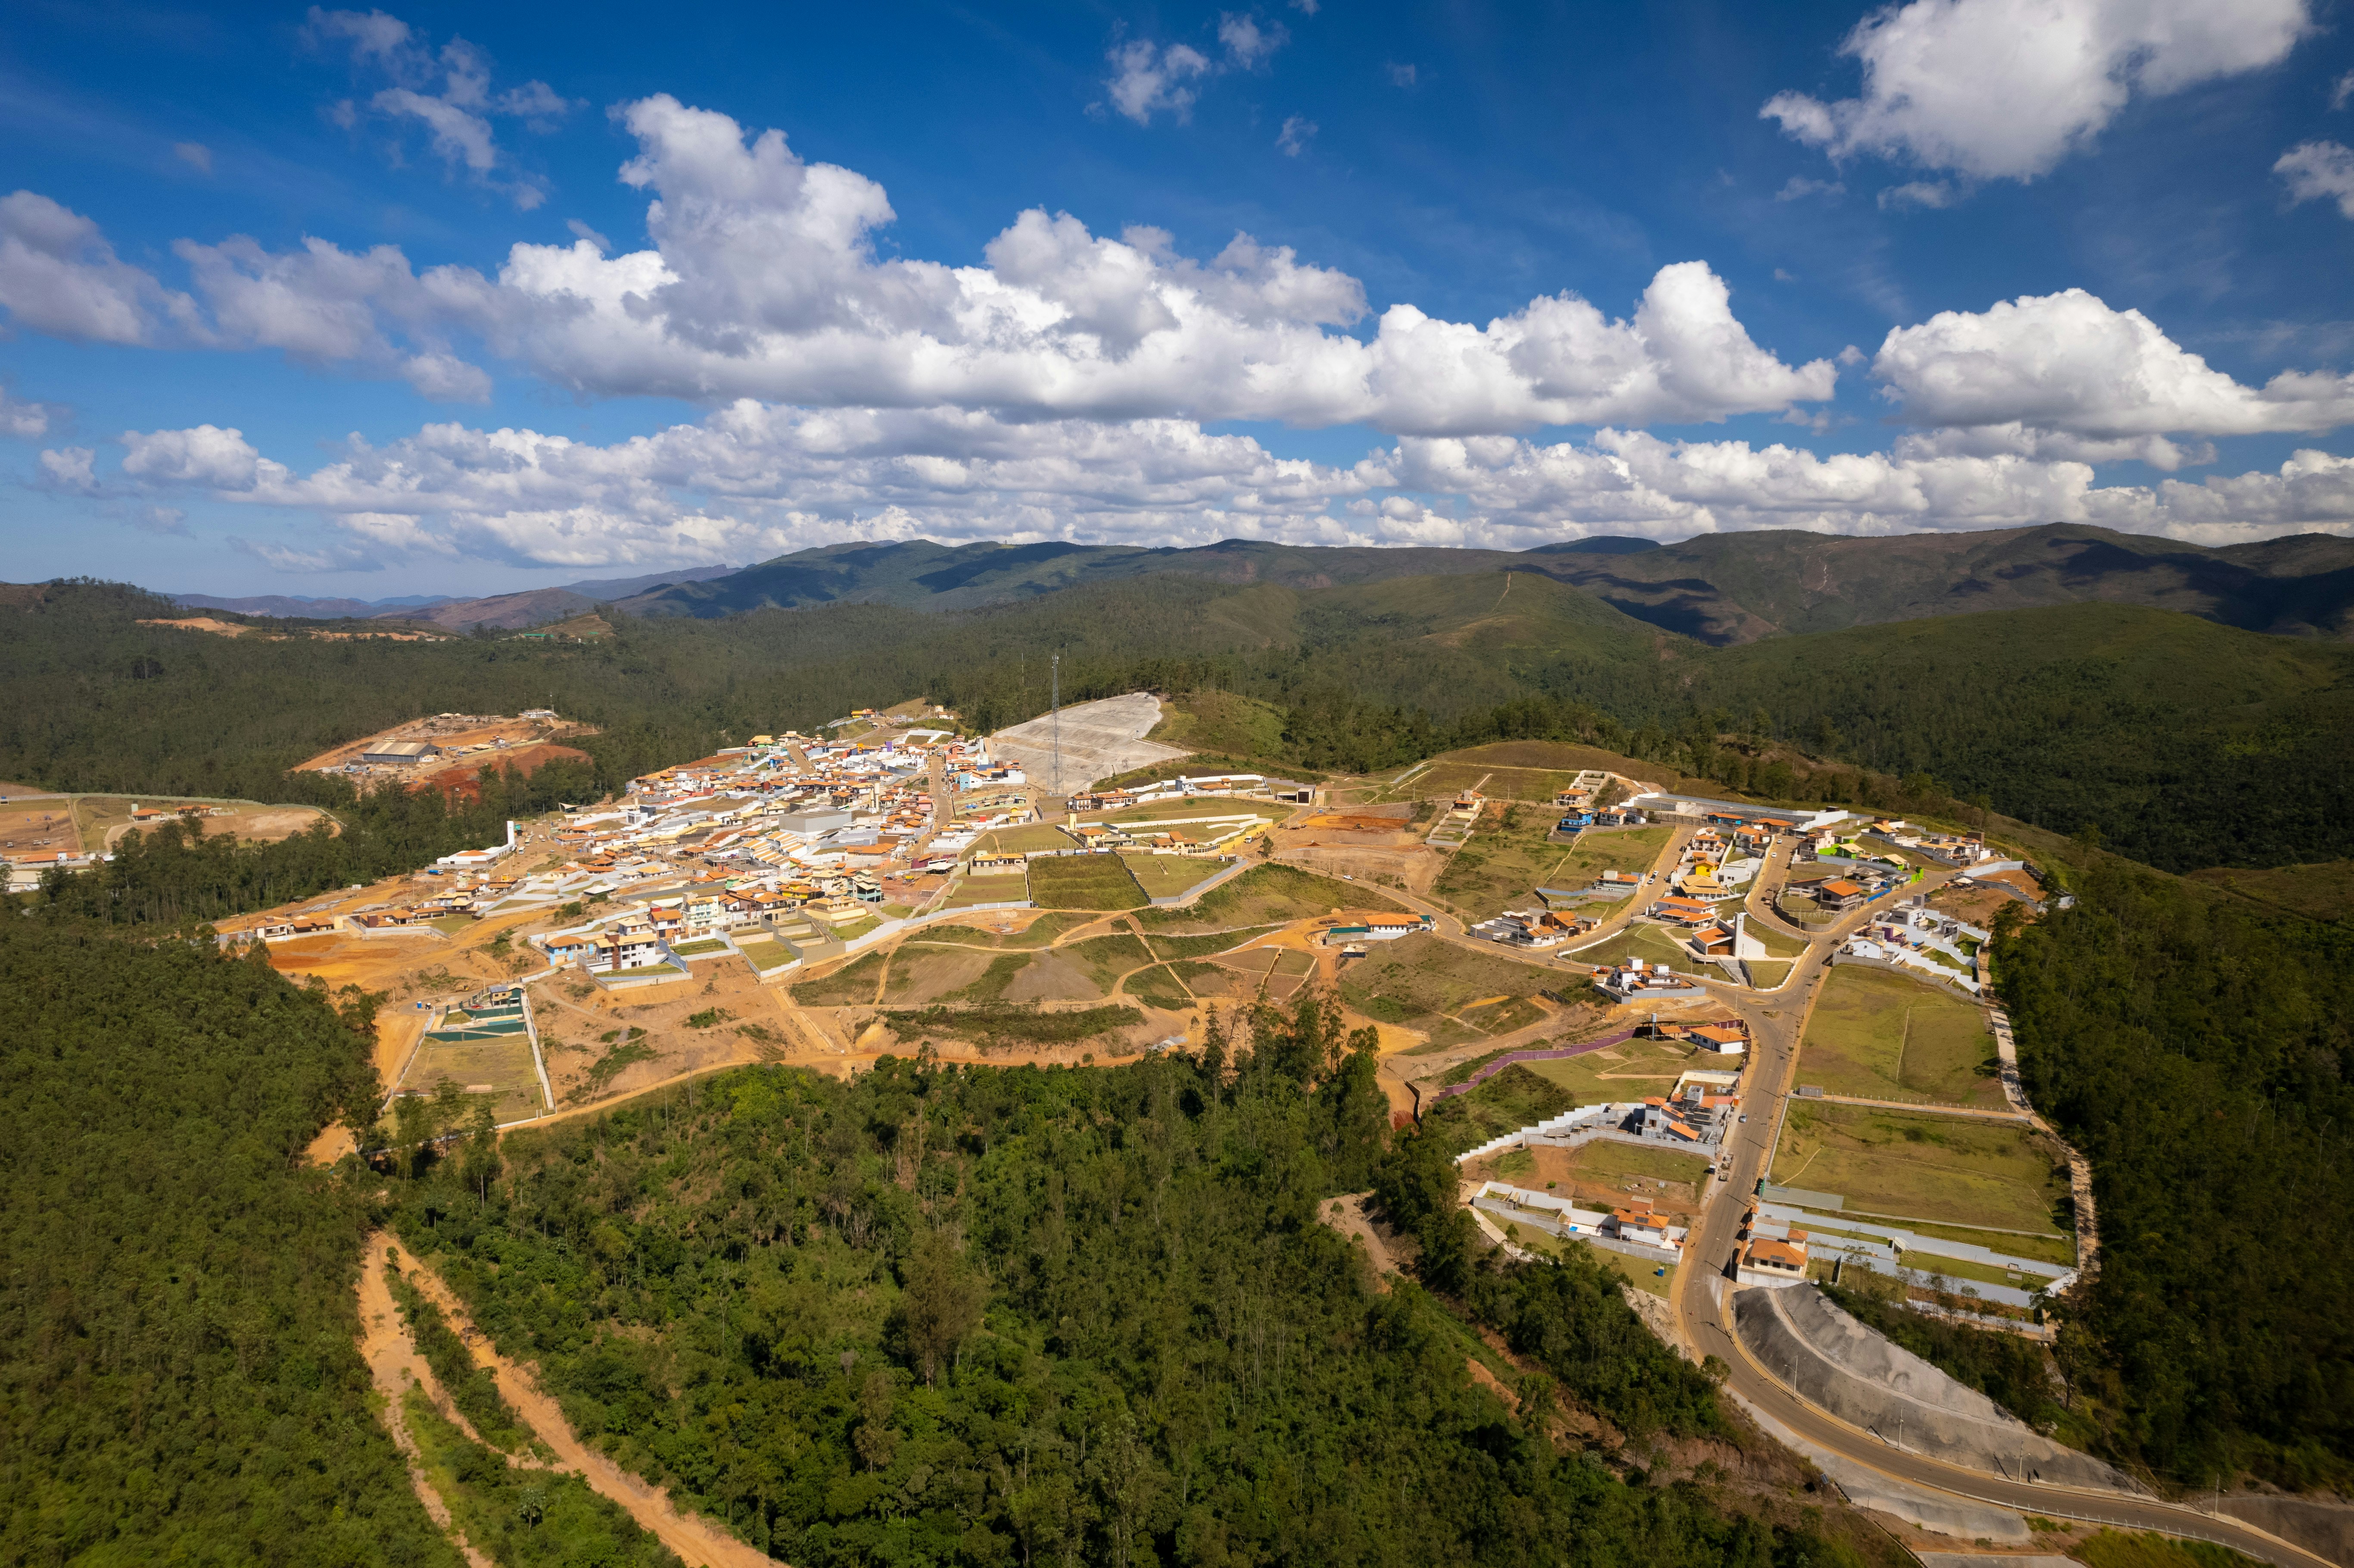
Driving a future where companies protect biodiversity, restore ecosystems, and operate within planetary boundaries.
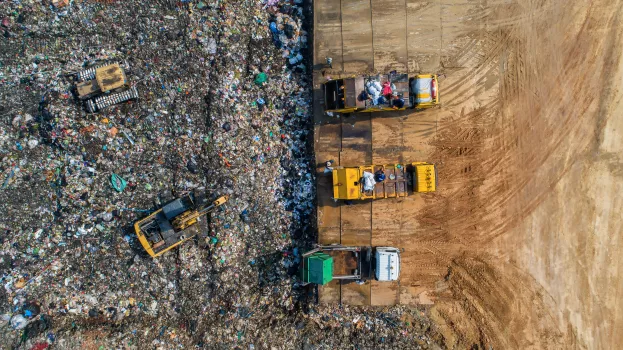
We assess how the world’s most influential companies advance a nature-positive future by cutting damaging practices across their operations and supply chains, and by actively restoring and improving ecosystems. The level of action and progress these large businesses make will directly affect whether we achieve the goals of the Global Biodiversity Framework.
Despite poor average performance, examples of best practice are emerging
Companies score an average of 17 out of 100 in the Nature Benchmark, underscoring how much progress is still needed to protect the ecosystems we all rely on. At the same time, every element of the methodology is met by at least one company, showing that improvement is realistic and achievable.
Materiality assessments are becoming mainstream, but implementation strategies need clear financial backing
Over half of companies identify and prioritise their most material sustainability impacts, yet only 13% embed these into a sustainability strategy. Even fewer (7%) disclose the financial or human resources allocated to implement the strategy, raising concerns about whether stated ambitions will translate into action.

Early signs of companies assessing nature-related impacts and dependencies
A small but notable proportion of companies quantify their impacts (17%) and their dependencies (14%) on nature. These disclosures demonstrate that nature is increasingly considered as a business issue and align with the expectations under Target 15 of the Global Biodiversity Framework. Company reporting also indicates that guidance and frameworks on these topics, developed by organisations like TNFD (mentioned by 26% of companies) and SBTN (mentioned by 10% of companies), are increasingly featuring in corporate disclosures.

European companies set the pace, but leadership should not be taken for granted
European companies largely remain the frontrunners, and 35% of company reports mentioned CSRD, demonstrating the effectiveness of strong and clear regulatory requirements. However, progress is reversible, as declining average scores in the United States show. Strong performance in Thailand, Taiwan, and South Africa also signals emerging sustainability leadership elsewhere.

Weak environmental integration undermines human rights protections in key sectors
Environmental degradation can directly undermine livelihoods, health, land rights, and access to resources. Yet, environmental considerations are incorporated into human rights due diligence by just 10% of companies, with particularly low uptake in high-risk sectors such as Agricultural Products and Apparel. At the same time, in industries like Food Production and Metals & Mining, only around 1% of companies disclose a robust commitment to obtain free, prior, and informed consent, exposing heightened risks for Indigenous Peoples.

Nature Benchmark latest


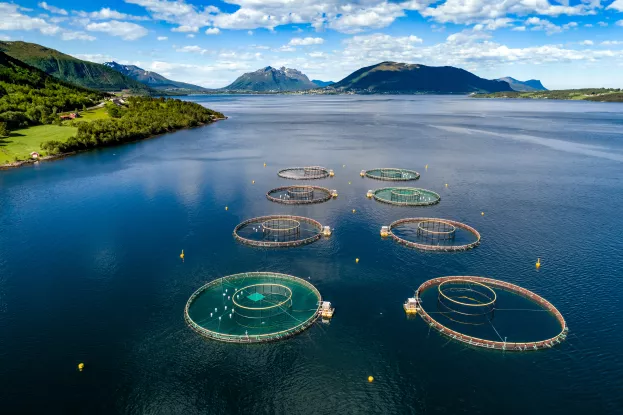
Ocean Benchmark
Our last Nature Benchmark results showed that corporate action to maintain and promote marine biodiversity is lagging behind action for land and freshwater resources. Driven by the urgency of filling this gap, we developed the Ocean Benchmark to assess 125 companies in key ocean-related sectors and evaluate their contribution to halting and reversing biodiversity loss in marine ecosystems.

Access this data
Explore the latest data, download for further analysis or integrate into your own workflows using our API.

Subscribe to stay informed on our work
Keep up to date with all the latest from World Benchmarking Alliance
