Circularity is in Nature – How circularity still features in our Nature Benchmark
Last year we pivoted from working on a Circular Benchmark to a Nature Benchmark. A circular economy is key to a sustainable future as it enables a restorative and regenerative economy. However, our latest benchmark is the Nature Benchmark, not the Circular Benchmark. If circularity is so important, why did we pivot? Why did we decide to make this change?
This blog offers an alternative and ‘circular‘ reading to our newest benchmark. It shows that, while we may have changed the name, circularity is still very much front and centre in our Nature Benchmark and is key to understanding its methodology more deeply.
Why is a circular economy important?
The linear economy
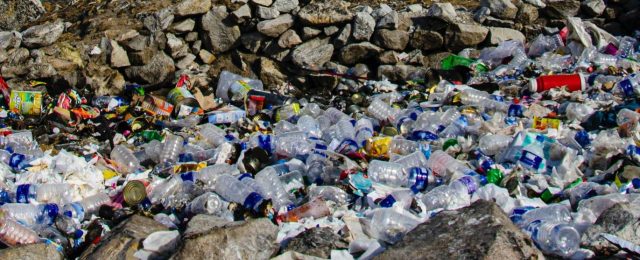
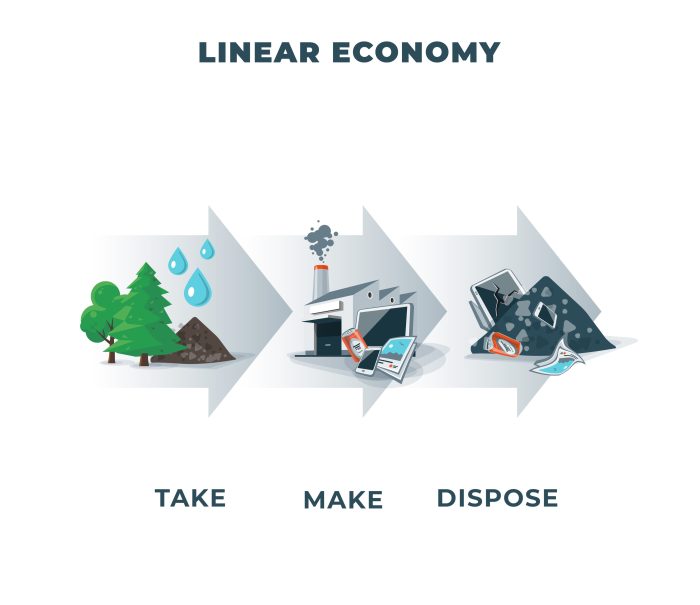
Before diving into why we transitioned from a Circular to a Nature Benchmark, I’d like to first expand on the concept of circular economy. The circular economy is best understood in contrast to the linear take-make-waste economy. In the linear economy, resources are extracted and processed into products that are later discarded.
This extractive business model prevails despite its critical negative impact on nature and biodiversity. This way of extracting and processing materials, fuels and food is the cause of 90% of biodiversity loss and 50% of global GHG emissions. With over half of the global GDP dependent on nature, this paints a risky picture for our future.
The circular economy
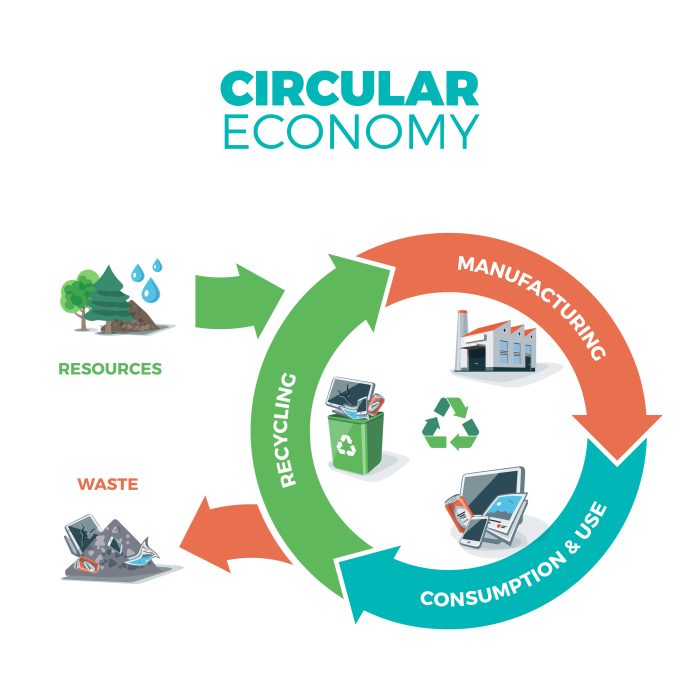
The circular economy comes as an alternative to this current economy of waste. As a framework for production and consumption, it imitates the natural cycle and calls for the decoupling of economic prosperity from resource exploitation.
The circular economy builds over three overarching principles: designing out waste and pollution; keeping products and materials in use; and regenerating natural systems.
Following a strict waste hierarchy, this framework relies on avoidance, reduction, reuse, repair and eventually recycling. By tackling the waste economy, the circular economy is a unique opportunity for companies to create more value through more efficient use of resources. As such, it is an essential instrument in the fight against the climate and biodiversity crisis.
For this reason, it has increasingly featured on the international agenda, notably taking a central place in European legislation. Still, much needs to be done, as the world remains only 8.6% circular.
The shift from Circular to Nature Benchmark
If circularity is so important, why did we not publish a Circular benchmark? Should we not push for this very necessary transformation? There are three main reasons.
1 – Keeping it simple
Circular economy solutions are not the same for all industries: there is no ‘one-size fits all’. Circular economy tools are less relevant for certain sectors. For instance, while our scoping report highlighted that Extended Producer Responsibility (EPR) schemes had strong potential for the fashion industry, they make less sense for the mining industry.
As our benchmark covers over 1,000 companies across a large variety of industries, it was essential that we select simple and sector-agnostic measurements. This is notably critical for data consistency as we strive to avoid potentially ‘non-applicable’ indicators for specific industries.
2 – A circular economy framework can be limiting
Circular economy solutions alone are not sufficient for tackling climate change and biodiversity loss. They can reduce pressures on nature but cannot easily address mass consumerism and overconsumption. A circular economy is an enabler, not a substitute, to a solid sustainability strategy.
To prevent biodiversity collapse, companies need to first understand their particular impacts and dependencies on biodiversity, and appreciate what activity or action areas to prioritise accordingly. Before taking any action, industries need to assess the current ‘state of nature’. Doing otherwise may limit their regenerative impact and even be counterproductive.
While lying beyond the traditional scope of the circular economy, this critical aspect had to be covered methodologically, as represented in indicators B1 to B4 (see Figure 1 below).
Similarly, issues such as biodiversity or social considerations are often overlooked within the circular economy framework as its traditional focus is ‘technical’, centred on economic and environmental impacts. This might partly be because although it holds much promises for the future of business, the concept and practice of circular economy in industry is still in its relative infancy.
3 – Building on a movement
The final reason for a Nature Benchmark over a Circular one, brings us back to the fundamentals of WBA’s mandate. The goal of our benchmarks is to spell out stakeholders’ expectations on sustainability. That’s why we build our methodologies on existing standards and best practices through a multi-stakeholder approach to ensure that we’re not reinventing the wheel.
As we received stakeholders’ feedback, it became clearer that growing expectations resided in a Nature Benchmark. Our key partners emphasised the accountability gap in this area as Nature, while still an emerging field, bestows a universal human narrative as well as a necessary industrial impact.
The previous work of the Intergovernmental Science-Policy Platform on Biodiversity and Ecosystem Services (IPBES) and publication of the Science Based Targets Network (SBTN) guidance further strengthened this Nature movement around a common language (e.g. ‘state of nature’ and ‘pressures on nature’). In this context, a Nature Benchmark organically extended our circular work.
Circular features front and centre in our Nature Benchmark
While we pivoted to a Nature benchmark, we did not give up on circularity. In fact, as per the circular cycle of Nature, the Nature benchmark covers all key aspects of circularity.
The benchmark’s ‘Circular‘ shadow
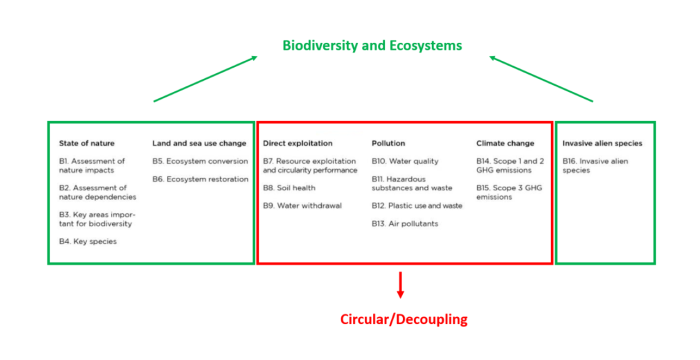
We have divided the methodology for our Nature benchmark into three broad measurement areas, namely: governance and strategy; ecosystems and biodiversity; and social inclusion and community Impact (see below Figure 1).
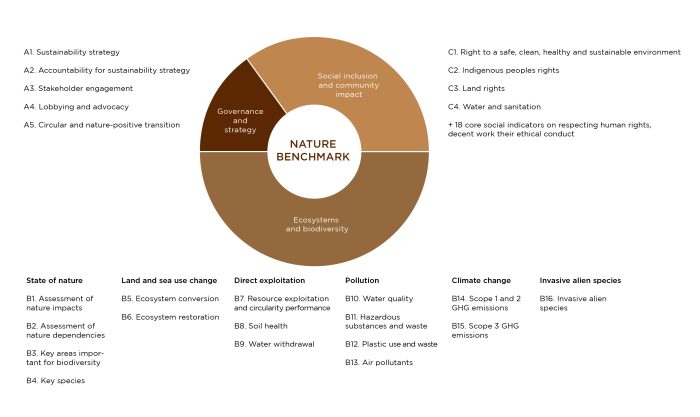
The main measurement area, ecosystems and biodiversity, can actually be further divided into two: ‘ecosystems and biodiversity’ covering indicators B1 to B6 as well as B16, and ‘circular/decoupling’ which covers indicators B7 to B15 (see below Figure 2).
This latter, more subtle, set of circular indicators covers all the traditional economic and environmental aspects of the circular economy. It also adopts a simple material flows perspective.
By looking at inflows – resources that enter the company – and outflows – resources that leave the company – this approach provides strong insights into resource use optimisation and the link between a company’s performance and circularity. It is widely used, notably by the Ellen MacArthur Foundation Circulytics tool and the World Business Council for Sustainable Development (WBSCD) Circular Transition Indicators.
Resource exploitation as the core
A crucial ‘Circular’ indicator is indicator B7: ’Resource exploitation and circularity performance’. This indicator focuses on a company’s use of resources/inputs, be it fossil ores, metals ores, living organisms, etc. This emphasis is very deliberate as overconsumption fundamentally is the key issue. It also avoids the trap of focusing on waste and recycling, a perspective that distracts from the real value of implementing circularity holistically.
That being said, companies still need to gather waste data (for example % of recyclable waste) to fully meet this indicator. The last two and more heavily weighted elements focus on group-wide circularity performance.
Inspired by the Value the Loop module from WBCSD Circular Transition Indicators, they go beyond material flows and provide insights into the value the circular business creates. They are meant to slash through ‘circular washing’ as they both require quantitative and consistent data.
Finally, the last element investigates the company’s effectiveness in decoupling financial performance and linear resource consumption. By linking circular and financial performance, it reveals little competitive information from companies while making it a key metric for investors.
-
Elements of WBA’s Nature Benchmark, indicator B7:
a. The company provides qualitative evidence of working towards a circular economy at distinct phases of its products’ life cycle.
b. The company discloses its inputs, including its material footprint, according to an international standard.
c. The company discloses which organisms it directly exploits for commercial uses, including wild animal and plant species.
d. The company discloses a management plan related to the direct exploitation of resources, to avoid overexploitation and the use of threatened species.
e. The company reports quantitatively on its group-wide circularity performance (e.g. circular material productivity).
f. The company meets element e. and demonstrates it is decoupling financial performance and linear resource consumption.
A fully circular approach
After this deep dive into key circularity metrics, let’s zoom out a bit. While we focused so far on the ‘technical’ circular economy, the Nature Benchmark embraces a fully circular approach. What does it mean?
Circularity is nascent, although maturing in some industries. We are still learning how to avoid the pitfalls of the technical circular economy. A fully circular approach allows a more comprehensive picture, and includes issues such as biodiversity and social equity. This approach is at the core of our methodology.
The benchmark indicators overview (see above, Figure 1) highlights how our methodology looks beyond overall resource-use optimisation and tackles other aspects of circularity such as biodiversity or social impacts. It is also present at the strategy level with indicator A5 ’Circular and nature-positive transition’, as it asks companies to assess their dependence on a linear economy and seeks to assess their first steps in a transition to regenerative business models.
Leaving no one behind
This fully circular lens is particularly visible through the ’Social inclusion and community impact’ measurement area. Circularity is merely a means to a socially just and ecologically safe world. Being environmentally friendly is only half the battle, and the circular economy requires a circular society. This set of indicators aims to leave no one behind, and ensures companies economic activities do not hurt communities and the broader society in the process.
The Nature Benchmark has four specific indicators, including the right to a safe, clean, healthy and sustainable environment, with eighteen additional core social indicators. These core social indicators further affirm high-level societal expectations of businesses, including companies paying their workers a living wage or providing healthy and safe workplaces.
Together, they demonstrate whether companies are contributing to fair, resilient and prosperous societies and enable a fair circular economy.
Circularity is in nature
Nature is fundamentally regenerative and society as whole, including corporations, needs to be too. Much work still has to be done to reconcile our relationship with nature. The extractive linear economy remains, by far, the dominant system. It is however a model we designed and one that we can redesign too. Solutions are already there, including circularity, and we can learn much from the traditional knowledge of Indigenous peoples on that aspect. All that’s left to do is act.